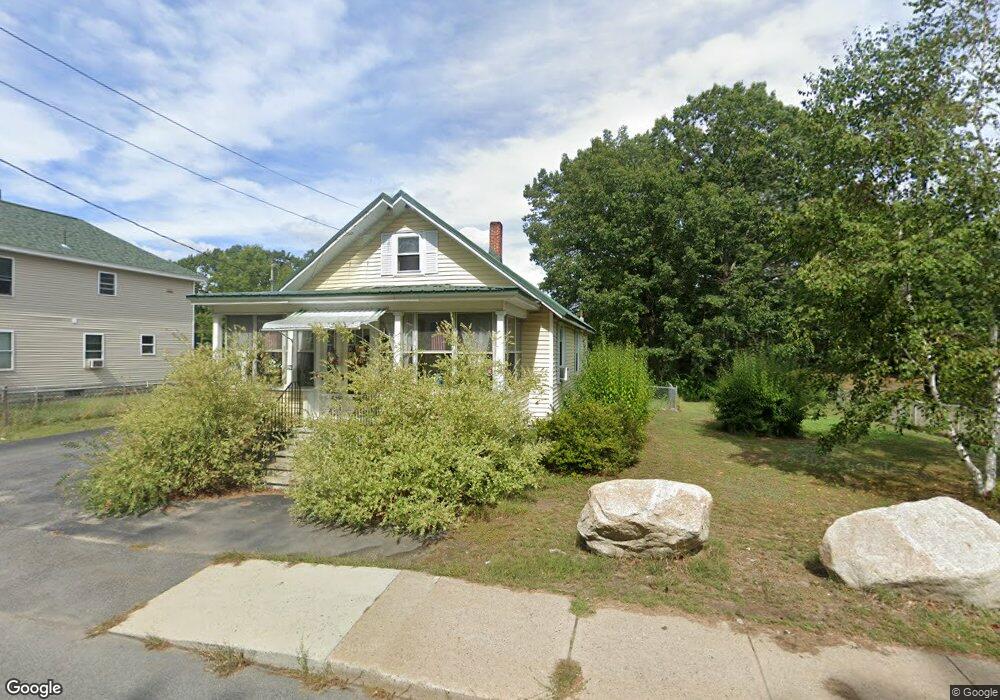
1172 Main St Sanford, ME 04073
Estimated Value: $274,000 - $337,000
2
Beds
1
Bath
1,061
Sq Ft
$293/Sq Ft
Est. Value
About This Home
This home is located at 1172 Main St, Sanford, ME 04073 and is currently estimated at $310,935, approximately $293 per square foot. 1172 Main St is a home located in York County with nearby schools including Sanford Christian Academy and St Thomas Consolidated School.
Ownership History
Date
Name
Owned For
Owner Type
Purchase Details
Closed on
Feb 12, 2020
Sold by
Hartford Steven P
Bought by
Hartford Steven P and Hartford Katrina L
Current Estimated Value
Purchase Details
Closed on
Jun 22, 2015
Sold by
Seaman Michael R and Seaman Susan A
Bought by
Hartford Steven P
Home Financials for this Owner
Home Financials are based on the most recent Mortgage that was taken out on this home.
Original Mortgage
$30,000
Interest Rate
3.78%
Mortgage Type
New Conventional
Create a Home Valuation Report for This Property
The Home Valuation Report is an in-depth analysis detailing your home's value as well as a comparison with similar homes in the area
Home Values in the Area
Average Home Value in this Area
Purchase History
| Date | Buyer | Sale Price | Title Company |
|---|---|---|---|
| Hartford Steven P | -- | None Available | |
| Hartford Steven P | -- | None Available | |
| Hartford Steven P | -- | None Available | |
| Hartford Steven P | -- | -- | |
| Hartford Steven P | -- | -- |
Source: Public Records
Mortgage History
| Date | Status | Borrower | Loan Amount |
|---|---|---|---|
| Closed | Hartford Steven P | $30,000 |
Source: Public Records
Tax History Compared to Growth
Tax History
| Year | Tax Paid | Tax Assessment Tax Assessment Total Assessment is a certain percentage of the fair market value that is determined by local assessors to be the total taxable value of land and additions on the property. | Land | Improvement |
|---|---|---|---|---|
| 2025 | $3,632 | $212,400 | $37,700 | $174,700 |
| 2024 | $3,428 | $212,400 | $37,700 | $174,700 |
| 2023 | $3,190 | $210,700 | $37,700 | $173,000 |
| 2022 | $3,118 | $210,700 | $37,700 | $173,000 |
| 2021 | $3,076 | $169,200 | $37,700 | $131,500 |
| 2020 | $3,119 | $154,700 | $37,700 | $117,000 |
| 2019 | $2,859 | $138,100 | $37,700 | $100,400 |
| 2018 | $2,776 | $135,400 | $37,700 | $97,700 |
| 2017 | $2,678 | $129,100 | $37,700 | $91,400 |
| 2016 | $2,720 | $119,600 | $37,700 | $81,900 |
| 2015 | $2,834 | $128,600 | $38,200 | $90,400 |
| 2014 | $2,780 | $128,600 | $38,200 | $90,400 |
| 2013 | -- | $128,600 | $38,200 | $90,400 |
Source: Public Records
Map
Nearby Homes