1172 Verlan Way Cheyenne, WY 82009
Estimated Value: $602,000 - $697,022
--
Bed
--
Bath
1,717
Sq Ft
$386/Sq Ft
Est. Value
About This Home
This home is located at 1172 Verlan Way, Cheyenne, WY 82009 and is currently estimated at $663,007, approximately $386 per square foot. 1172 Verlan Way is a home with nearby schools including Saddle Ridge Elementary School, Carey Junior High School, and East High School.
Ownership History
Date
Name
Owned For
Owner Type
Purchase Details
Closed on
Nov 16, 2015
Sold by
Rg Construction Llc
Bought by
Lantz Matt and Lantz Alyssa
Current Estimated Value
Home Financials for this Owner
Home Financials are based on the most recent Mortgage that was taken out on this home.
Original Mortgage
$291,000
Outstanding Balance
$228,723
Interest Rate
3.85%
Mortgage Type
New Conventional
Estimated Equity
$434,284
Purchase Details
Closed on
Sep 22, 2015
Sold by
Graves Nathan
Bought by
Graves Empire Llc
Home Financials for this Owner
Home Financials are based on the most recent Mortgage that was taken out on this home.
Original Mortgage
$291,000
Outstanding Balance
$228,723
Interest Rate
3.85%
Mortgage Type
New Conventional
Estimated Equity
$434,284
Purchase Details
Closed on
Aug 10, 2015
Sold by
Js Bar Corp
Bought by
Graves Nathan
Purchase Details
Closed on
Jun 8, 2015
Sold by
Js Bar Corp
Bought by
Rg Construction Llc
Create a Home Valuation Report for This Property
The Home Valuation Report is an in-depth analysis detailing your home's value as well as a comparison with similar homes in the area
Home Values in the Area
Average Home Value in this Area
Purchase History
| Date | Buyer | Sale Price | Title Company |
|---|---|---|---|
| Lantz Matt | -- | First American Title | |
| Graves Empire Llc | -- | Summit Title Services | |
| Graves Nathan | -- | Summit Title Services | |
| Rg Construction Llc | -- | Summit Title Services |
Source: Public Records
Mortgage History
| Date | Status | Borrower | Loan Amount |
|---|---|---|---|
| Open | Lantz Matt | $291,000 |
Source: Public Records
Tax History Compared to Growth
Tax History
| Year | Tax Paid | Tax Assessment Tax Assessment Total Assessment is a certain percentage of the fair market value that is determined by local assessors to be the total taxable value of land and additions on the property. | Land | Improvement |
|---|---|---|---|---|
| 2025 | $4,256 | $48,280 | $4,106 | $44,174 |
| 2024 | $4,256 | $63,376 | $5,264 | $58,112 |
| 2023 | $4,245 | $63,305 | $5,264 | $58,041 |
| 2022 | $3,821 | $55,644 | $5,025 | $50,619 |
| 2021 | $3,399 | $48,836 | $5,025 | $43,811 |
| 2020 | $3,088 | $45,753 | $5,025 | $40,728 |
| 2019 | $2,906 | $43,243 | $5,025 | $38,218 |
| 2018 | $2,372 | $35,659 | $5,025 | $30,634 |
| 2017 | $2,207 | $32,855 | $4,559 | $28,296 |
| 2016 | $1,953 | $29,059 | $4,307 | $24,752 |
| 2015 | $67 | $1,003 | $1,003 | $0 |
| 2014 | $62 | $910 | $910 | $0 |
Source: Public Records
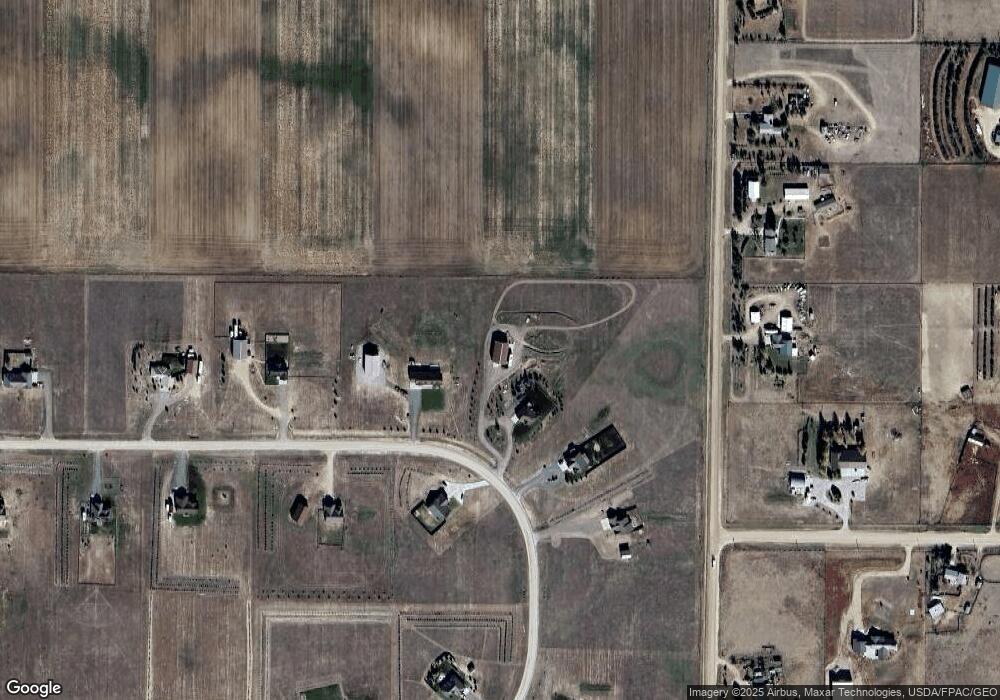
Map
Nearby Homes
- 3443 Road 212
- 3590 Burns Ave
- 1258 War Admiral Rd
- 3456 Road 212
- 1243 Affirmed Rd
- 1285 War Admiral Rd
- 1266 Affirmed Rd
- 3491 Stampede Ranch Rd
- 17415 Anna Loop
- 12611 Glencoe Dr
- 11803 Glencoe Dr
- 3584 Moonstone Trail
- 11107 Stadel Rd
- 10531 Choke Cherry Rd
- 1470 Earhart Dr
- 3636 Sky Train Dr
- 3684 Sky Train Dr
- 1077 Golden Range Dr
- Tract 1 Four Mile Rd
- 3666 Aviator Ct
- 1174 Verlan Way
- 1168 Verlan Way
- 1173 Verlan Way
- 1176 Verlan Way
- 0 Cody Ln Unit 70685
- 1167 Verlan Way
- 1166 Verlan Way
- 1145 Road 135
- 1181 Verlan Way
- 1151 Road 135
- 3504 Cody Ln
- 1178 Verlan Way
- 1187 Verlan Way
- 1165 Verlan Way
- 1127 Road 135
- 1159 Road 135
- 1164 Verlan Way
- L9 B1 Cody Ln
- Tract 21 Verlan Way
- T 21 Verlan Way