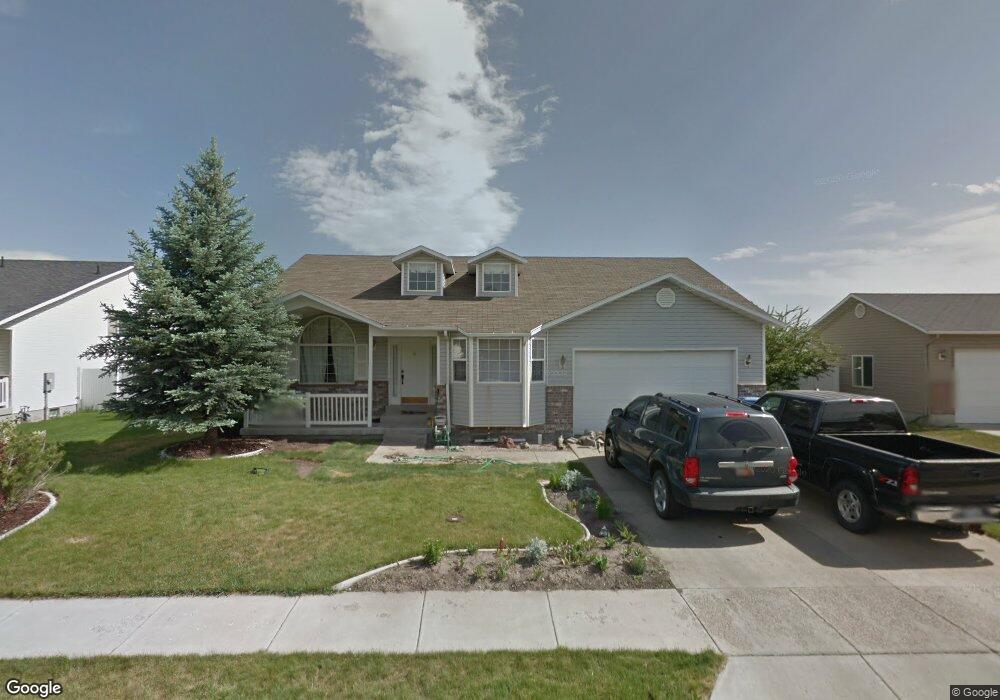
1172 W 450 S Logan, UT 84321
Woodruff NeighborhoodEstimated Value: $385,888 - $424,000
4
Beds
2
Baths
1,885
Sq Ft
$216/Sq Ft
Est. Value
About This Home
This home is located at 1172 W 450 S, Logan, UT 84321 and is currently estimated at $406,472, approximately $215 per square foot. 1172 W 450 S is a home located in Cache County with nearby schools including Woodruff School, Mount Logan Middle School, and Logan High School.
Ownership History
Date
Name
Owned For
Owner Type
Purchase Details
Closed on
Sep 2, 2020
Sold by
Piel Jeremy R
Bought by
Piel Jeremy R and Piel Allison
Current Estimated Value
Home Financials for this Owner
Home Financials are based on the most recent Mortgage that was taken out on this home.
Original Mortgage
$138,000
Outstanding Balance
$122,140
Interest Rate
3%
Mortgage Type
New Conventional
Estimated Equity
$284,332
Purchase Details
Closed on
Aug 7, 2020
Sold by
Mangum Allison and Piel Allison
Bought by
Piel Jaremy R and Piel Allison
Home Financials for this Owner
Home Financials are based on the most recent Mortgage that was taken out on this home.
Original Mortgage
$138,000
Outstanding Balance
$122,140
Interest Rate
3%
Mortgage Type
New Conventional
Estimated Equity
$284,332
Purchase Details
Closed on
Aug 1, 2011
Sold by
Harris Victor W and Harris Heidi
Bought by
Mangum Allison
Home Financials for this Owner
Home Financials are based on the most recent Mortgage that was taken out on this home.
Original Mortgage
$6,000
Interest Rate
4.53%
Mortgage Type
Stand Alone Second
Create a Home Valuation Report for This Property
The Home Valuation Report is an in-depth analysis detailing your home's value as well as a comparison with similar homes in the area
Home Values in the Area
Average Home Value in this Area
Purchase History
| Date | Buyer | Sale Price | Title Company |
|---|---|---|---|
| Piel Jeremy R | -- | Advanced Title | |
| Piel Jeremy R | -- | Advanced Title | |
| Piel Jaremy R | -- | Advanced Title | |
| Mangum Allison | -- | Heritage Title |
Source: Public Records
Mortgage History
| Date | Status | Borrower | Loan Amount |
|---|---|---|---|
| Open | Piel Jeremy R | $138,000 | |
| Closed | Mangum Allison | $6,000 | |
| Closed | Mangum Allison | $152,841 |
Source: Public Records
Tax History
| Year | Tax Paid | Tax Assessment Tax Assessment Total Assessment is a certain percentage of the fair market value that is determined by local assessors to be the total taxable value of land and additions on the property. | Land | Improvement |
|---|---|---|---|---|
| 2025 | $1,681 | $217,380 | $0 | $0 |
| 2024 | $1,725 | $216,085 | $0 | $0 |
| 2023 | $1,787 | $213,375 | $0 | $0 |
| 2022 | $1,583 | $176,525 | $0 | $0 |
| 2021 | $1,538 | $264,965 | $41,000 | $223,965 |
| 2020 | $1,355 | $210,131 | $41,000 | $169,131 |
| 2019 | $1,417 | $210,130 | $41,000 | $169,130 |
| 2018 | $1,389 | $188,070 | $41,000 | $147,070 |
| 2017 | $1,304 | $93,335 | $0 | $0 |
| 2016 | $1,351 | $93,335 | $0 | $0 |
| 2015 | $1,271 | $87,670 | $0 | $0 |
| 2014 | $1,149 | $87,670 | $0 | $0 |
| 2013 | -- | $87,670 | $0 | $0 |
Source: Public Records
Map
Nearby Homes
- 1099 Three Pointe Ave
- 508 S 1215 W Unit 144
- 539 S 1215 W Unit 129
- 551 S 1215 W Unit 131
- 370 S 1200 W Unit 2
- 1204 W 575 S
- 1214 W 575 S
- 1210 W 575 S Unit 163
- 1210 W 575 S
- 1239 W 575 S
- 1031 W 350 S
- 952 W 330 S
- 1400 S 940 W
- 245 S 1280 W
- 207 Sunstone Cir
- 501 Southwest St
- 553 Center Ave
- 1615 Silver Canoe Way
- 1585 W Silver Canoe Way
- 1506 Silver Canoe Loop
- 1172 Three Pointe Ave
- 1180 Three Pointe Ave
- 1158 W 450 S
- 1158 Three Point Ave
- 1142 Three Point Ave
- 1142 W 450 S
- 454 S 1200 W
- 448 S 1200 W
- 1128 W 450 S
- 1128 Three Point Ave
- 439 S Oak Creek Place
- 432 S Oak Creek Place
- 432 S Oak Creek Place Unit 69
- 446 Oakcreek Place
- 440 S Oak Creek Place
- 439 Oakcreek Place
- 438 S 1200 W Unit 13
- 438 S 1200 W
- 431 Oakcreek Place
- 1116 Three Pointe Ave
Your Personal Tour Guide
Ask me questions while you tour the home.