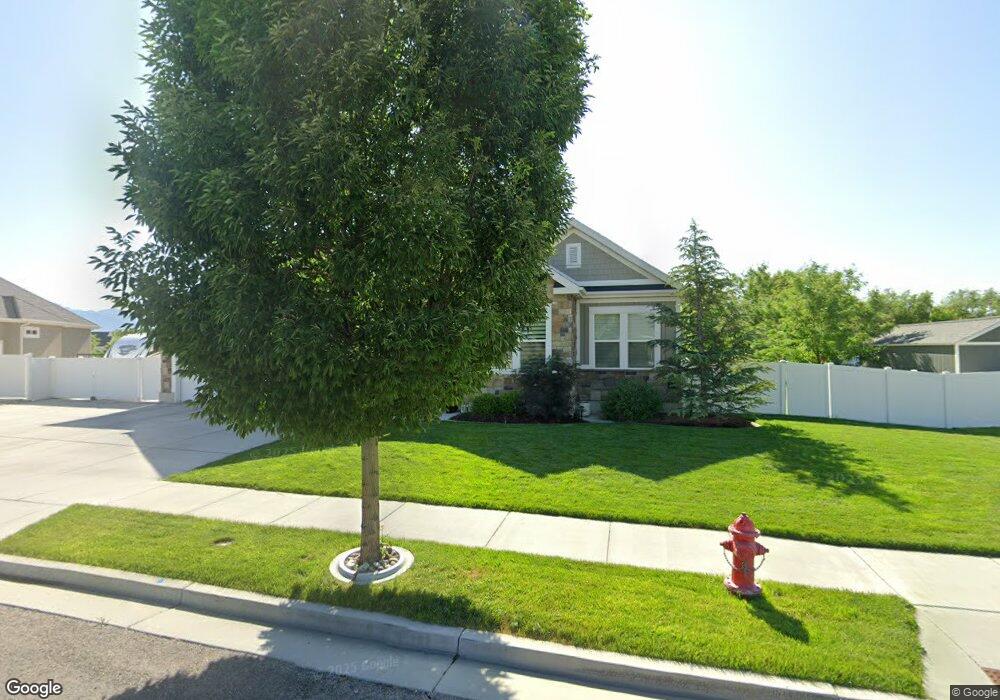
11723 S Midas Side Way Riverton, UT 84065
Estimated Value: $640,000 - $920,246
2
Beds
3
Baths
3,976
Sq Ft
$207/Sq Ft
Est. Value
About This Home
This home is located at 11723 S Midas Side Way, Riverton, UT 84065 and is currently estimated at $822,062, approximately $206 per square foot. 11723 S Midas Side Way is a home located in Salt Lake County with nearby schools including Rosamond Elementary School, Oquirrh Hills Middle School, and Riverton High School.
Ownership History
Date
Name
Owned For
Owner Type
Purchase Details
Closed on
Aug 20, 2020
Sold by
Burnham Bryan S and Burnham Michelle M
Bought by
Burnham Bryan S and Burnham Michelle M
Current Estimated Value
Home Financials for this Owner
Home Financials are based on the most recent Mortgage that was taken out on this home.
Original Mortgage
$270,500
Outstanding Balance
$192,071
Interest Rate
3%
Mortgage Type
New Conventional
Estimated Equity
$629,991
Purchase Details
Closed on
Mar 26, 2019
Sold by
Burnham Bryan S and Burnham Michelle M
Bought by
Burnham Bryan S and Burnham Michelle M
Purchase Details
Closed on
Feb 11, 2016
Sold by
Ivory Homes Ltd
Bought by
Burnham Bryan S and Burnham Michelle M
Home Financials for this Owner
Home Financials are based on the most recent Mortgage that was taken out on this home.
Original Mortgage
$300,000
Interest Rate
3.98%
Mortgage Type
New Conventional
Create a Home Valuation Report for This Property
The Home Valuation Report is an in-depth analysis detailing your home's value as well as a comparison with similar homes in the area
Home Values in the Area
Average Home Value in this Area
Purchase History
| Date | Buyer | Sale Price | Title Company |
|---|---|---|---|
| Burnham Bryan S | -- | Us Title | |
| Burnham Bryan S | -- | Us Title | |
| Burnham Bryan S | -- | None Available | |
| Burnham Bryan S | -- | Cottonwood Title | |
| Ivory Homes Ltd | -- | Cottonwood Title Insurance A |
Source: Public Records
Mortgage History
| Date | Status | Borrower | Loan Amount |
|---|---|---|---|
| Open | Burnham Bryan S | $270,500 | |
| Closed | Burnham Bryan S | $300,000 |
Source: Public Records
Tax History Compared to Growth
Tax History
| Year | Tax Paid | Tax Assessment Tax Assessment Total Assessment is a certain percentage of the fair market value that is determined by local assessors to be the total taxable value of land and additions on the property. | Land | Improvement |
|---|---|---|---|---|
| 2025 | $4,651 | $827,400 | $270,500 | $556,900 |
| 2024 | $4,651 | $804,900 | $257,700 | $547,200 |
| 2023 | $4,635 | $756,300 | $250,200 | $506,100 |
| 2022 | $4,774 | $764,100 | $245,300 | $518,800 |
| 2021 | $3,927 | $559,600 | $202,700 | $356,900 |
| 2020 | $3,882 | $515,800 | $202,700 | $313,100 |
| 2019 | $3,755 | $490,500 | $191,800 | $298,700 |
| 2018 | $3,612 | $464,500 | $190,800 | $273,700 |
| 2017 | $3,556 | $445,700 | $187,500 | $258,200 |
| 2016 | $2,447 | $294,300 | $173,300 | $121,000 |
Source: Public Records
Map
Nearby Homes
- 11788 S Myers Park Ln Unit 101
- 11707 S Myers Park Ln Unit 111
- 2295 W Myers Ln
- 11716 S 2610 W
- 2626 W Midas Side Way
- 2602 W 11625 S
- 11513 S Jackson Downs Way
- 11666 S Gold Dust Dr
- 2732 W Lizzi Cove
- 2410 W 11400 S
- 2817 W 11460 St S Unit 203
- 12034 S 1900 W
- 2853 W 12075 S
- 1767 W Lunford Ln
- 11423 S Polo Club Ct
- 1721 W Hollow Cedar Ln Unit 1
- 3168 Chalk Creek Way
- 1611 W Laurel Chase Dr
- 1592 W Andover Rd
- 3028 W Wilkins Peak Ct
- 11739 S King Midas Ct
- 11709 S Midas Side Way
- 2422 W 11730 S
- 11697 S Midas Side Way
- 11751 S King Midas Ct
- 11742 S King Midas Ct
- 2434 W 11730 S
- 2431 W Midas Side Way
- 2447 W 11730 S
- 2414 W Midas Side Way
- 2452 W 11730 S
- 11763 S King Midas Ct
- 2453 W Midas Side Way
- 11734 S Myers Park Ln Unit 104
- 11758 Myers Ln Unit 103
- 2466 W 11730 S
- 2461 W 11730 S
- 11710 S Myers Park Ln Unit 106
- 2372 W 11800 S
- 2410 Myers Ln