11725 Ioka Way NW Silverdale, WA 98383
Estimated Value: $809,000 - $1,464,987
2
Beds
1
Bath
1,434
Sq Ft
$845/Sq Ft
Est. Value
About This Home
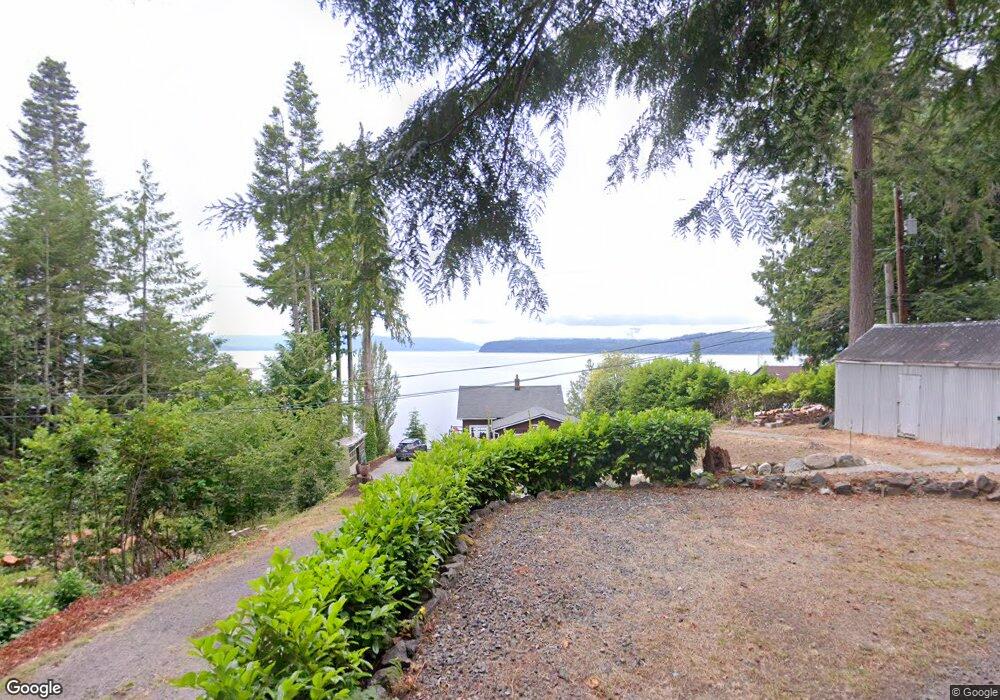
This home is located at 11725 Ioka Way NW, Silverdale, WA 98383 and is currently estimated at $1,212,247, approximately $845 per square foot. 11725 Ioka Way NW is a home located in Kitsap County with nearby schools including Cougar Valley Elementary School, Central Kitsap Middle School, and Central Kitsap High School.
Ownership History
Date
Name
Owned For
Owner Type
Purchase Details
Closed on
Oct 1, 2014
Sold by
Fredrickson Katharina Vongontard and Fredrickson Kent Allen
Bought by
Hall Kenneth M and Hall Stephanie L
Current Estimated Value
Home Financials for this Owner
Home Financials are based on the most recent Mortgage that was taken out on this home.
Original Mortgage
$75,245
Outstanding Balance
$57,622
Interest Rate
4.07%
Mortgage Type
Credit Line Revolving
Estimated Equity
$1,154,625
Purchase Details
Closed on
Aug 5, 2004
Sold by
Mandak Brian Paul and Mandak Norman John
Bought by
Vongontard Fredrickson Katharina and Fredrickson Kent Allen
Purchase Details
Closed on
Dec 4, 2003
Sold by
Mandak Brian Paul and Mandak John
Bought by
Mandak Brian Paul and Mandak Norman John
Purchase Details
Closed on
Oct 28, 2002
Sold by
Mandak Bernadine R
Bought by
Mandak Brian Paul and Mandak John
Create a Home Valuation Report for This Property
The Home Valuation Report is an in-depth analysis detailing your home's value as well as a comparison with similar homes in the area
Home Values in the Area
Average Home Value in this Area
Purchase History
| Date | Buyer | Sale Price | Title Company |
|---|---|---|---|
| Hall Kenneth M | $547,000 | Pacific Northwest Title | |
| Vongontard Fredrickson Katharina | $522,000 | Transnation Title | |
| Mandak Brian Paul | -- | -- | |
| Mandak Brian Paul | -- | -- | |
| Mandak Brian Paul | -- | -- |
Source: Public Records
Mortgage History
| Date | Status | Borrower | Loan Amount |
|---|---|---|---|
| Open | Hall Kenneth M | $75,245 |
Source: Public Records
Tax History Compared to Growth
Tax History
| Year | Tax Paid | Tax Assessment Tax Assessment Total Assessment is a certain percentage of the fair market value that is determined by local assessors to be the total taxable value of land and additions on the property. | Land | Improvement |
|---|---|---|---|---|
| 2026 | $11,031 | $1,192,170 | $879,730 | $312,440 |
| 2025 | $11,031 | $1,192,170 | $879,730 | $312,440 |
| 2024 | $10,727 | $1,192,170 | $879,730 | $312,440 |
| 2023 | $10,083 | $1,114,820 | $892,620 | $222,200 |
| 2022 | $9,566 | $932,310 | $744,880 | $187,430 |
| 2021 | $9,155 | $848,790 | $677,160 | $171,630 |
| 2020 | $7,348 | $688,530 | $530,600 | $157,930 |
| 2019 | $7,578 | $688,530 | $530,600 | $157,930 |
| 2018 | $8,940 | $581,870 | $493,230 | $88,640 |
| 2017 | $7,338 | $581,870 | $493,230 | $88,640 |
| 2016 | $7,931 | $581,870 | $493,230 | $88,640 |
| 2015 | $7,595 | $581,870 | $493,230 | $88,640 |
| 2014 | -- | $527,680 | $448,390 | $79,290 |
| 2013 | -- | $527,680 | $448,390 | $79,290 |
Source: Public Records
Map
Nearby Homes
- 11363 Anderson Landing NW
- 777 NW Anderson Hill Rd
- 7645 NW Lenox Ln
- 10625 Treasure Dr NW
- 10625 Treasure Dr NW Unit 123
- 6550 NW Mathwig Ln
- 10637 Treasure Dr NW Unit 121
- 10637 Treasure Dr NW
- 10656 Treasure Dr NW Unit 107
- 10656 Treasure Dr NW
- 10661 Treasure Dr NW
- 10661 Treasure Dr NW Unit 117
- 10667 Treasure Dr NW Unit 116
- 10685 Treasure Dr NW Unit 113
- 10662 Treasure Dr NW Unit 108
- Oscar Plan at Sterling Hills
- Coronado Plan at Sterling Hills
- 10662 Treasure Dr NW
- Hemingway Plan at Sterling Hills
- 10673 Treasure Dr NW
- 11745 Ioka Way NW
- 11705 Ioka Way NW
- 11855 Ioka Way NW
- 11685 Ioka Way NW
- 11877 Ioka Way NW
- 11665 Ioka Way NW
- 11895 Ioka Way NW
- 11655 Ioka Way NW
- 7700 NW Mountain Vista Ln
- 7710 NW Mountain Vista Ln
- 12015 Ioka Way NW
- 7685 NW Mountain Vista Ln
- 7308 NW Duckabush Ln
- 12025 Ioka Way NW
- 7309 NW Duckabush Ln
- 7020 NW Puddingstone Ln
- 7655 NW Mountain Vista Ln
- 12035 Ioka Way NW
- 7304 NW Duckabush Ln
- 7305 NW Duckabush Ln