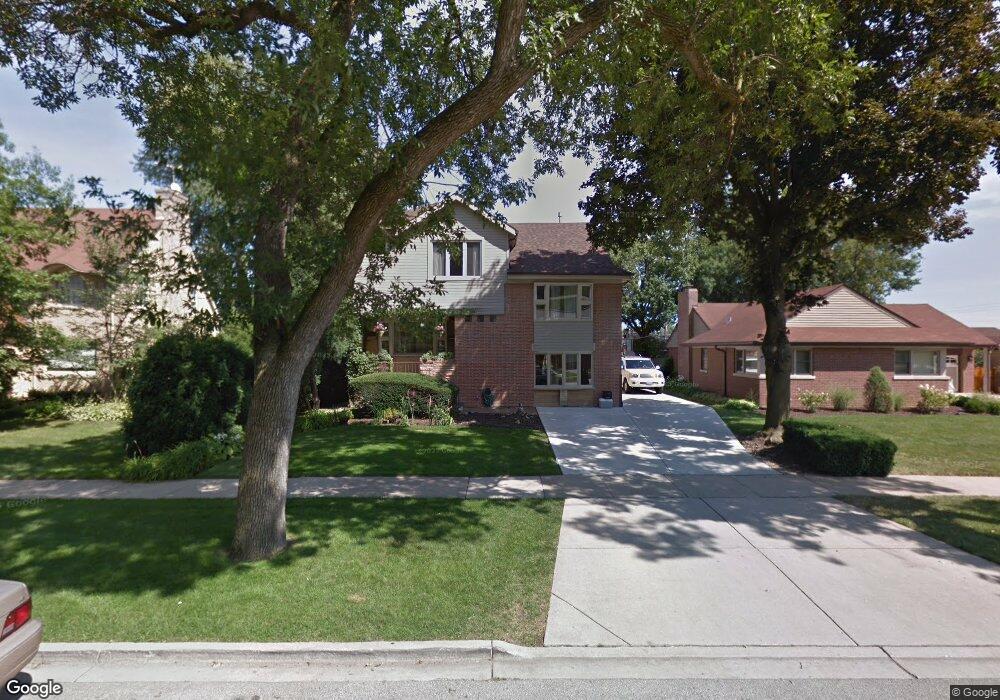
1173 Jeannette St Des Plaines, IL 60016
Estimated Value: $464,000 - $581,000
4
Beds
2
Baths
2,549
Sq Ft
$208/Sq Ft
Est. Value
About This Home
This home is located at 1173 Jeannette St, Des Plaines, IL 60016 and is currently estimated at $529,378, approximately $207 per square foot. 1173 Jeannette St is a home located in Cook County with nearby schools including Forest Elementary School, Algonquin Middle School, and Maine West High School.
Ownership History
Date
Name
Owned For
Owner Type
Purchase Details
Closed on
Mar 12, 2025
Sold by
Lopez Manfred D
Bought by
Mdl Trust
Current Estimated Value
Purchase Details
Closed on
Mar 10, 2004
Sold by
Brunetti Giuseppe and Brunetti Domenica
Bought by
Lopez Manfred and Lopez Omaira V
Home Financials for this Owner
Home Financials are based on the most recent Mortgage that was taken out on this home.
Original Mortgage
$298,800
Interest Rate
7.75%
Mortgage Type
Unknown
Purchase Details
Closed on
Oct 19, 1993
Sold by
Brunetti Giuseppe and Brunetti Domenica
Bought by
Brunetti Giuseppe and Brunetti Domenica
Home Financials for this Owner
Home Financials are based on the most recent Mortgage that was taken out on this home.
Original Mortgage
$115,000
Interest Rate
7.25%
Create a Home Valuation Report for This Property
The Home Valuation Report is an in-depth analysis detailing your home's value as well as a comparison with similar homes in the area
Home Values in the Area
Average Home Value in this Area
Purchase History
| Date | Buyer | Sale Price | Title Company |
|---|---|---|---|
| Mdl Trust | -- | None Listed On Document | |
| Lopez Manfred | $332,000 | Atgf Inc | |
| Brunetti Giuseppe | -- | -- |
Source: Public Records
Mortgage History
| Date | Status | Borrower | Loan Amount |
|---|---|---|---|
| Previous Owner | Lopez Manfred | $298,800 | |
| Previous Owner | Brunetti Giuseppe | $115,000 |
Source: Public Records
Tax History Compared to Growth
Tax History
| Year | Tax Paid | Tax Assessment Tax Assessment Total Assessment is a certain percentage of the fair market value that is determined by local assessors to be the total taxable value of land and additions on the property. | Land | Improvement |
|---|---|---|---|---|
| 2024 | $9,469 | $39,232 | $8,389 | $30,843 |
| 2023 | $9,215 | $39,232 | $8,389 | $30,843 |
| 2022 | $9,215 | $39,232 | $8,389 | $30,843 |
| 2021 | $9,189 | $33,225 | $6,711 | $26,514 |
| 2020 | $9,103 | $33,225 | $6,711 | $26,514 |
| 2019 | $9,012 | $36,917 | $6,711 | $30,206 |
| 2018 | $8,077 | $30,444 | $5,872 | $24,572 |
| 2017 | $7,952 | $30,444 | $5,872 | $24,572 |
| 2016 | $7,766 | $30,444 | $5,872 | $24,572 |
| 2015 | $7,410 | $27,133 | $5,033 | $22,100 |
| 2014 | $8,290 | $30,581 | $5,033 | $25,548 |
| 2013 | $8,066 | $30,581 | $5,033 | $25,548 |
Source: Public Records
Map
Nearby Homes
- 915 Graceland Ave Unit 1E
- 1380 Oakwood Ave Unit 306
- 1365 Ashland Ave Unit 302
- 1394 Carol Ln
- 1489 E Algonquin Rd
- 905 Center St Unit B507
- 905 Center St Unit B208
- 991 Wicke Ave
- 799 Graceland Ave Unit 504A
- 1056 E Villa Dr
- 1157 W Grant Dr
- 843 Lexington Cir E
- 1050 E Oakton St
- 881 E Thacker St
- 1524 Oakwood Ave
- 858 E Grant Dr
- 911 E Villa Dr
- 886 E Thacker St
- 821 Lexington Cir E
- 648 1st Ave
- 1183 Jeannette St
- 1159 Jeannette St
- 1195 Jeannette St
- 1149 Jeannette St
- 1149 Jeannette St
- 1192 Lee St
- 1133 Jeannette St
- 1184 Jeannette St
- Lot E Jeanette Ave
- 1172 Jeannette St
- 1162 Jeannette St
- 1192 Jeannette St
- 1156 Jeannette St
- 1125 Jeannette St
- 1146 Jeannette St
- 1167 E Algonquin Rd
- 1143 E Algonquin Rd
- 1119 Jeannette St
- 1138 Jeannette St
- 1173 E Algonquin Rd