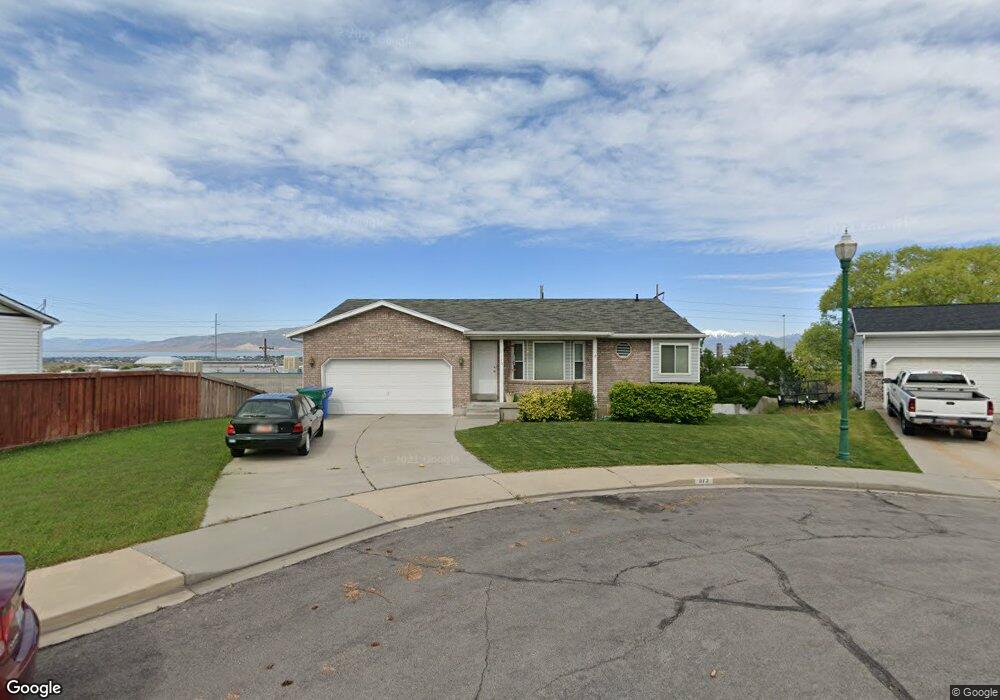
1173 N 1165 W Orem, UT 84057
Bonneville NeighborhoodEstimated Value: $520,000 - $554,978
3
Beds
3
Baths
2,430
Sq Ft
$222/Sq Ft
Est. Value
About This Home
This home is located at 1173 N 1165 W, Orem, UT 84057 and is currently estimated at $540,326, approximately $222 per square foot. 1173 N 1165 W is a home located in Utah County with nearby schools including Bonneville Elementary School, Orem Junior High School, and Timpanogos High School.
Ownership History
Date
Name
Owned For
Owner Type
Purchase Details
Closed on
Nov 30, 2016
Sold by
Cloward Bernell R and Cloward Karen C
Bought by
Jclan Enterprises Llc
Current Estimated Value
Purchase Details
Closed on
Oct 31, 2013
Sold by
Kerr Mary E
Bought by
Cloward Bernell R and Cloward Karen C
Home Financials for this Owner
Home Financials are based on the most recent Mortgage that was taken out on this home.
Original Mortgage
$146,800
Interest Rate
4.46%
Mortgage Type
New Conventional
Purchase Details
Closed on
Feb 5, 1999
Sold by
Kerr Mary E
Bought by
Kerr Mary E
Home Financials for this Owner
Home Financials are based on the most recent Mortgage that was taken out on this home.
Original Mortgage
$130,000
Interest Rate
6.73%
Create a Home Valuation Report for This Property
The Home Valuation Report is an in-depth analysis detailing your home's value as well as a comparison with similar homes in the area
Home Values in the Area
Average Home Value in this Area
Purchase History
| Date | Buyer | Sale Price | Title Company |
|---|---|---|---|
| Jclan Enterprises Llc | -- | None Available | |
| Cloward Bernell R | -- | Access Title Co | |
| Kerr Mary E | -- | Mountain West Title Co |
Source: Public Records
Mortgage History
| Date | Status | Borrower | Loan Amount |
|---|---|---|---|
| Previous Owner | Cloward Bernell R | $146,800 | |
| Previous Owner | Kerr Mary E | $130,000 |
Source: Public Records
Tax History
| Year | Tax Paid | Tax Assessment Tax Assessment Total Assessment is a certain percentage of the fair market value that is determined by local assessors to be the total taxable value of land and additions on the property. | Land | Improvement |
|---|---|---|---|---|
| 2025 | $2,123 | $286,385 | -- | -- |
| 2024 | $2,123 | $259,600 | $0 | $0 |
| 2023 | $1,987 | $261,140 | $0 | $0 |
| 2022 | $1,917 | $244,090 | $0 | $0 |
| 2021 | $1,786 | $344,400 | $147,500 | $196,900 |
| 2020 | $1,641 | $311,000 | $118,000 | $193,000 |
| 2019 | $1,498 | $295,200 | $118,000 | $177,200 |
| 2018 | $1,476 | $278,000 | $107,900 | $170,100 |
| 2017 | $1,385 | $139,755 | $0 | $0 |
| 2016 | $1,413 | $131,395 | $0 | $0 |
| 2015 | $1,339 | $117,810 | $0 | $0 |
| 2014 | $1,284 | $112,420 | $0 | $0 |
Source: Public Records
Map
Nearby Homes
- 1004 N 1090 W Unit 203
- 999 W 1100 N
- 1015 N 995 W
- 1140 W 950 N Unit D302
- 1140 W 950 N Unit E202
- 1140 W 950 N Unit D304
- 1086 N 1005 W
- 1253 W 1420 N
- 930 N 980 W
- 1303 W 1480 N
- 1260 W 1480 N Unit BLDG
- 1514 N 1285 W Unit 58
- 1167 W 1550 N
- 1326 W 1480 N
- 1123 N 800 W
- 1405 N 770 W
- 967 W 1630 N
- 1230 N 685 W
- 1663 N 980 W
- 954 W 630 N Unit 34,
Your Personal Tour Guide
Ask me questions while you tour the home.