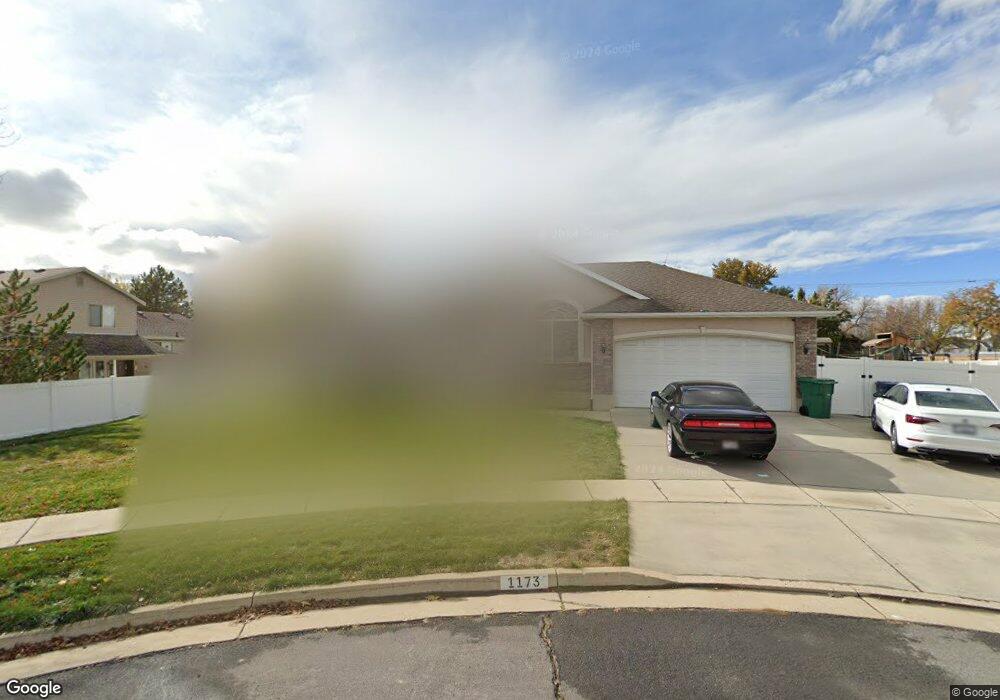
1173 W 25 S Layton, UT 84041
Estimated Value: $622,000 - $694,000
6
Beds
3
Baths
3,373
Sq Ft
$195/Sq Ft
Est. Value
About This Home
This home is located at 1173 W 25 S, Layton, UT 84041 and is currently estimated at $659,339, approximately $195 per square foot. 1173 W 25 S is a home located in Davis County with nearby schools including Layton Elementary School, Fairfield Junior High School, and Layton High School.
Ownership History
Date
Name
Owned For
Owner Type
Purchase Details
Closed on
Jul 29, 2013
Sold by
Biddulph Chris F
Bought by
Roberds Russell A and Roberds Lindsey R
Current Estimated Value
Home Financials for this Owner
Home Financials are based on the most recent Mortgage that was taken out on this home.
Original Mortgage
$261,250
Outstanding Balance
$190,448
Interest Rate
3.98%
Mortgage Type
New Conventional
Estimated Equity
$468,891
Purchase Details
Closed on
Oct 17, 2008
Sold by
The Bank Of New York
Bought by
Biddulph Chris F
Home Financials for this Owner
Home Financials are based on the most recent Mortgage that was taken out on this home.
Original Mortgage
$209,000
Interest Rate
6.09%
Mortgage Type
Purchase Money Mortgage
Purchase Details
Closed on
Jul 31, 2008
Sold by
Gittins Floyd A
Bought by
The Bank Of New York
Create a Home Valuation Report for This Property
The Home Valuation Report is an in-depth analysis detailing your home's value as well as a comparison with similar homes in the area
Home Values in the Area
Average Home Value in this Area
Purchase History
| Date | Buyer | Sale Price | Title Company |
|---|---|---|---|
| Roberds Russell A | -- | First America Title Company | |
| Biddulph Chris F | -- | First American Title | |
| The Bank Of New York | $181,242 | Backman Title Services |
Source: Public Records
Mortgage History
| Date | Status | Borrower | Loan Amount |
|---|---|---|---|
| Open | Roberds Russell A | $261,250 | |
| Closed | Biddulph Chris F | $209,000 |
Source: Public Records
Tax History Compared to Growth
Tax History
| Year | Tax Paid | Tax Assessment Tax Assessment Total Assessment is a certain percentage of the fair market value that is determined by local assessors to be the total taxable value of land and additions on the property. | Land | Improvement |
|---|---|---|---|---|
| 2025 | -- | $320,650 | $141,711 | $178,939 |
| 2024 | -- | $311,850 | $151,090 | $160,760 |
| 2023 | $1,049 | $559,000 | $161,067 | $397,933 |
| 2022 | $1,049 | $333,300 | $92,951 | $240,349 |
| 2021 | $238 | $437,000 | $139,399 | $297,601 |
| 2020 | $2,264 | $382,000 | $119,326 | $262,674 |
| 2019 | $2,264 | $366,000 | $117,420 | $248,580 |
| 2018 | $0 | $335,000 | $103,534 | $231,466 |
| 2016 | $2,138 | $157,080 | $43,260 | $113,820 |
| 2015 | $2,124 | $148,115 | $43,260 | $104,855 |
| 2014 | $2,322 | $165,566 | $43,260 | $122,306 |
| 2013 | $1,730 | $116,813 | $30,182 | $86,631 |
Source: Public Records
Map
Nearby Homes
- 933 W Gentile St
- 1015 W 350 S
- 750 W Gentile St
- 362 S 950 W
- Browning Plan at Amber Fields
- Rhapsody Plan at Amber Fields
- Accord Plan at Amber Fields
- Timpani Plan at Amber Fields
- Octave Plan at Amber Fields
- Tempo Plan at Amber Fields
- Harvard Plan at Amber Fields
- Fortissimo Plan at Amber Fields
- Forte Plan at Amber Fields
- Interlude Plan at Amber Fields
- Concerto Plan at Amber Fields
- Bravo Plan at Amber Fields
- Capitol Plan at Amber Fields
- Anthem Plan at Amber Fields
- Adagio Plan at Amber Fields
- Trio Plan at Amber Fields