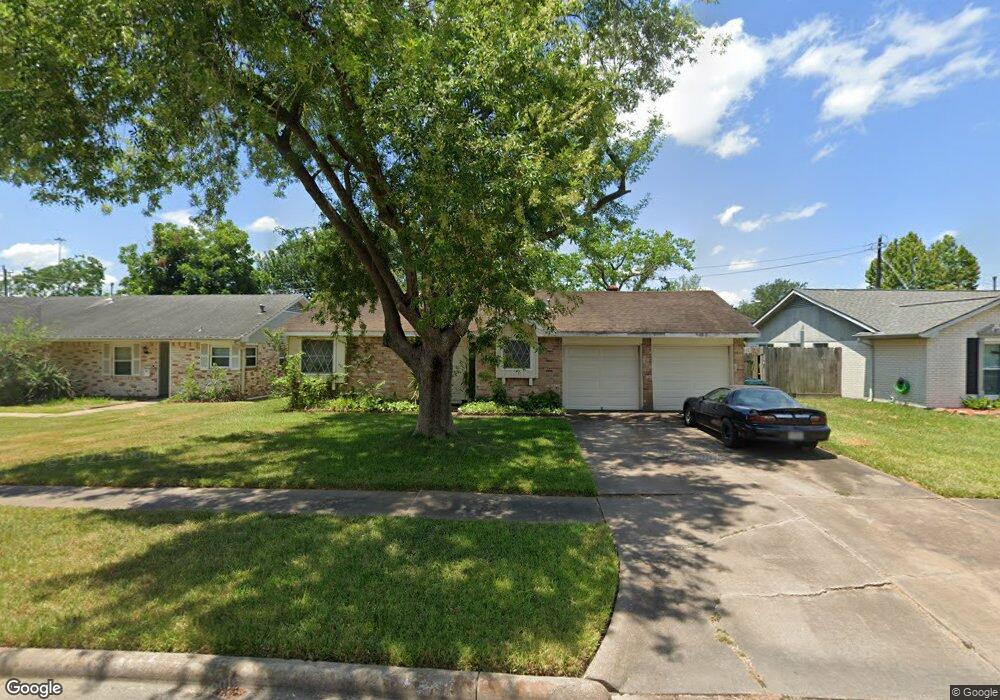
11730 Kirkmeadow Dr Houston, TX 77089
Southbelt-Ellington NeighborhoodEstimated Value: $186,000 - $236,000
3
Beds
2
Baths
1,214
Sq Ft
$173/Sq Ft
Est. Value
About This Home
This home is located at 11730 Kirkmeadow Dr, Houston, TX 77089 and is currently estimated at $209,666, approximately $172 per square foot. 11730 Kirkmeadow Dr is a home located in Harris County with nearby schools including Meador Elementary School, Beverly Hill Intermediate School, and Morris Middle School.
Ownership History
Date
Name
Owned For
Owner Type
Purchase Details
Closed on
Sep 18, 2025
Sold by
Tran Nga
Bought by
Tran Cang
Current Estimated Value
Purchase Details
Closed on
Apr 8, 2024
Sold by
Npm Legacy Llc
Bought by
Ntht Llc
Purchase Details
Closed on
Oct 3, 2019
Sold by
Tran Cang
Bought by
Tran Nga Thi
Purchase Details
Closed on
Sep 17, 2019
Sold by
Npm Legacy Llc
Bought by
Tran Cang
Purchase Details
Closed on
Aug 15, 2019
Sold by
Tran Cang and Huynh Hong Thi
Bought by
Npm Legacy Llc
Purchase Details
Closed on
Apr 25, 2014
Sold by
Us Bank Na
Bought by
Tran Phuong T
Purchase Details
Closed on
Aug 6, 2013
Sold by
Divin Brian J and Divin Penny L
Bought by
Us Bank Na
Purchase Details
Closed on
Jun 30, 1997
Sold by
Hein Dolores A Gratzek and Hein Richard L
Bought by
Divin Brian J and Divin Penny L
Create a Home Valuation Report for This Property
The Home Valuation Report is an in-depth analysis detailing your home's value as well as a comparison with similar homes in the area
Home Values in the Area
Average Home Value in this Area
Purchase History
| Date | Buyer | Sale Price | Title Company |
|---|---|---|---|
| Tran Cang | -- | None Listed On Document | |
| Tran Cang | -- | None Listed On Document | |
| Ntht Llc | -- | None Listed On Document | |
| Tran Nga Thi | -- | None Available | |
| Tran Cang | -- | None Available | |
| Npm Legacy Llc | -- | None Available | |
| Tran Phuong T | -- | None Available | |
| Us Bank Na | $65,450 | None Available | |
| Divin Brian J | -- | -- |
Source: Public Records
Tax History Compared to Growth
Tax History
| Year | Tax Paid | Tax Assessment Tax Assessment Total Assessment is a certain percentage of the fair market value that is determined by local assessors to be the total taxable value of land and additions on the property. | Land | Improvement |
|---|---|---|---|---|
| 2025 | $4,466 | $179,512 | $40,260 | $139,252 |
| 2024 | $4,466 | $178,061 | $40,260 | $137,801 |
| 2023 | $4,466 | $178,061 | $40,260 | $137,801 |
| 2022 | $4,399 | $171,818 | $40,260 | $131,558 |
| 2021 | $3,825 | $142,370 | $40,260 | $102,110 |
| 2020 | $3,868 | $141,104 | $40,260 | $100,844 |
| 2019 | $3,964 | $137,512 | $33,550 | $103,962 |
| 2018 | $1,640 | $116,921 | $25,834 | $91,087 |
| 2017 | $3,220 | $116,921 | $25,834 | $91,087 |
| 2016 | $3,130 | $113,662 | $25,834 | $87,828 |
| 2015 | $2,565 | $98,367 | $23,485 | $74,882 |
| 2014 | $2,565 | $91,529 | $20,130 | $71,399 |
Source: Public Records
Map
Nearby Homes
- 11930 Kirkway Dr
- 10507 Kirkhill Dr
- 10519 Kirkglen Dr
- 11107 Kirkpark Dr
- 11111 Sagecrest Ln
- 11414 Kirkwyn Dr
- 12023 Sagecliff Dr
- 11433 Sabo Rd
- 10906 Keese Dr
- 10810 Kirkbend Dr
- 10815 Ritow St
- 11311 Caribbean Ln
- 10519 Sagepark Ln
- 11303 Caribbean Ln
- 9743 Santa Monica Blvd
- 11123 Sageview Dr
- 11106 Sagehill Dr
- 10914 Sagepark Ln
- 10410 Sagestar Ln
- 10406 Sagestar Ln
- 11734 Kirkmeadow Dr
- 11726 Kirkmeadow Dr
- 11715 Kirkhollow Dr
- 11719 Kirkhollow Dr
- 11738 Kirkmeadow Dr
- 11718 Kirkmeadow Dr
- 11711 Kirkhollow Dr
- 11723 Kirkhollow Dr
- 11731 Kirkmeadow Dr
- 11727 Kirkmeadow Dr
- 11735 Kirkmeadow Dr
- 11742 Kirkmeadow Dr
- 11710 Kirkmeadow Dr
- 11739 Kirkmeadow Dr
- 11723 Kirkmeadow Dr
- 11727 Kirkhollow Dr
- 11707 Kirkhollow Dr
- 11719 Kirkmeadow Dr
- 11706 Kirkmeadow Dr
- 11718 Kirkway Dr