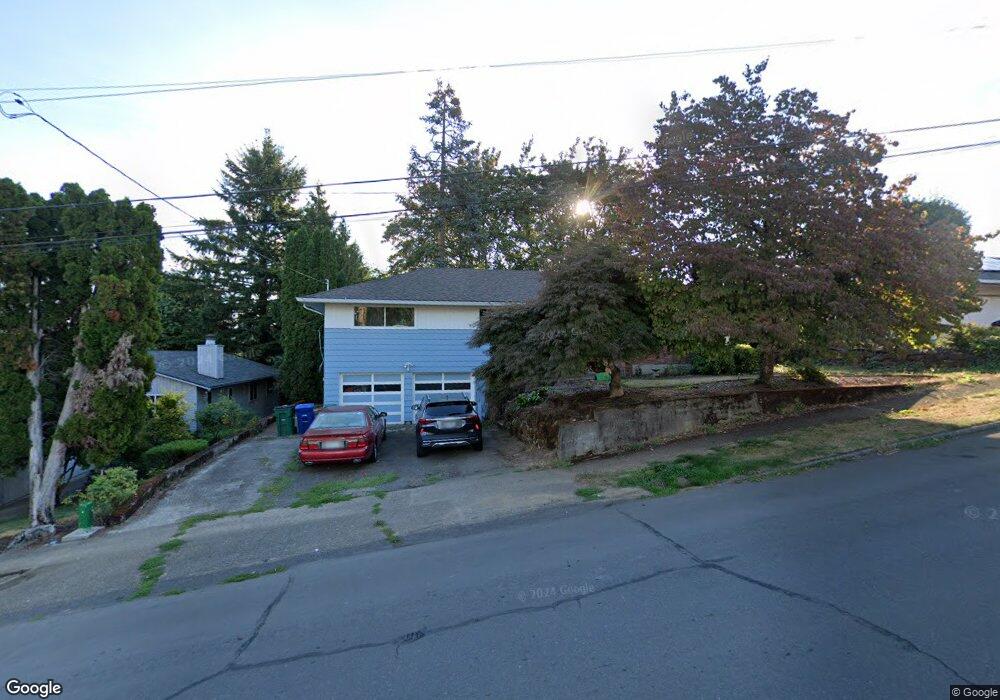
11730 SE 35th Ave Milwaukie, OR 97222
Lake Road NeighborhoodEstimated Value: $568,000 - $665,000
4
Beds
2
Baths
2,308
Sq Ft
$260/Sq Ft
Est. Value
About This Home
This home is located at 11730 SE 35th Ave, Milwaukie, OR 97222 and is currently estimated at $600,277, approximately $260 per square foot. 11730 SE 35th Ave is a home located in Clackamas County with nearby schools including Milwaukie Elementary School, Rowe Middle School, and Milwaukie High School.
Ownership History
Date
Name
Owned For
Owner Type
Purchase Details
Closed on
Dec 5, 2024
Sold by
Mckennie Timothy Dale
Bought by
Mckennie Angela
Current Estimated Value
Home Financials for this Owner
Home Financials are based on the most recent Mortgage that was taken out on this home.
Original Mortgage
$310,000
Outstanding Balance
$307,283
Interest Rate
6.79%
Mortgage Type
New Conventional
Estimated Equity
$292,994
Purchase Details
Closed on
May 28, 2009
Sold by
Hiner Stuart and Smith Geneva
Bought by
Mckennie Angela and Mckennie Timothy
Home Financials for this Owner
Home Financials are based on the most recent Mortgage that was taken out on this home.
Original Mortgage
$224,400
Interest Rate
4.8%
Mortgage Type
Purchase Money Mortgage
Purchase Details
Closed on
Nov 2, 2005
Sold by
Heinrichs Larry J and Heinrichs Lawrence Jacob
Bought by
Hiner Stuart and Hiner Geneva
Home Financials for this Owner
Home Financials are based on the most recent Mortgage that was taken out on this home.
Original Mortgage
$202,400
Interest Rate
5.25%
Mortgage Type
Fannie Mae Freddie Mac
Create a Home Valuation Report for This Property
The Home Valuation Report is an in-depth analysis detailing your home's value as well as a comparison with similar homes in the area
Home Values in the Area
Average Home Value in this Area
Purchase History
| Date | Buyer | Sale Price | Title Company |
|---|---|---|---|
| Mckennie Angela | -- | Lawyers Title | |
| Mckennie Angela | $280,500 | Lawyers Title Ins | |
| Hiner Stuart | $253,000 | Ticor Title Insurance Compan |
Source: Public Records
Mortgage History
| Date | Status | Borrower | Loan Amount |
|---|---|---|---|
| Open | Mckennie Angela | $310,000 | |
| Previous Owner | Mckennie Angela | $224,400 | |
| Previous Owner | Hiner Stuart | $202,400 |
Source: Public Records
Tax History Compared to Growth
Tax History
| Year | Tax Paid | Tax Assessment Tax Assessment Total Assessment is a certain percentage of the fair market value that is determined by local assessors to be the total taxable value of land and additions on the property. | Land | Improvement |
|---|---|---|---|---|
| 2025 | $6,179 | $280,794 | -- | -- |
| 2024 | $5,729 | $261,720 | -- | -- |
| 2023 | $5,729 | $254,098 | $0 | $0 |
| 2022 | $5,290 | $246,698 | $0 | $0 |
| 2021 | $5,105 | $239,513 | $0 | $0 |
| 2020 | $4,946 | $232,537 | $0 | $0 |
| 2019 | $4,872 | $225,765 | $0 | $0 |
| 2018 | $4,333 | $219,189 | $0 | $0 |
| 2017 | $4,209 | $212,805 | $0 | $0 |
| 2016 | $4,068 | $206,607 | $0 | $0 |
| 2015 | $3,873 | $200,589 | $0 | $0 |
| 2014 | $3,674 | $194,747 | $0 | $0 |
Source: Public Records
Map
Nearby Homes
- 11332 SE 31st Ave
- 4119 SE Northridge Dr
- 11265 SE 30th Ave
- 12632 SE 39th Ct
- 4134 SE Washington St
- 12600 SE Freeman Way
- 10845 SE Myrtle St
- 12712 SE 31st Ave
- 10801 SE Myrtle St
- 4657 SE Franklin St
- 10638 SE 34th Ave
- 12425 SE 27th Ave
- 12815 SE 31st Ave
- 11508 SE 48th Ave
- 4512 SE Garrett Cir
- 10475 SE 37th Ave
- 4805 SE Park St
- 10429 SE 36th Ave
- 4025 SE Llewellyn St
- 12437 SE 24th Ave
- 11724 SE 35th Ave
- 11772 SE 35th Ave
- 11789 SE 36th Ave
- 11708 SE 35th Ave
- 3536 SE Wister St
- 11731 SE 35th Ave
- 3601 SE Grogan Ave
- 11803 SE 36th Ave
- 11783 SE 35th Ave
- 3615 SE Grogan Ave
- 3435 SE Wister St
- 11825 SE 35th Ave
- 11658 SE 35th Ave
- 11851 SE 36th Ave
- 3521 SE Wister St
- 3612 SE Wister St
- 11710 SE 34th Ave
- 3637 SE Grogan Ave
- 11679 SE 35th Ave
- 11772 SE 34th Ave