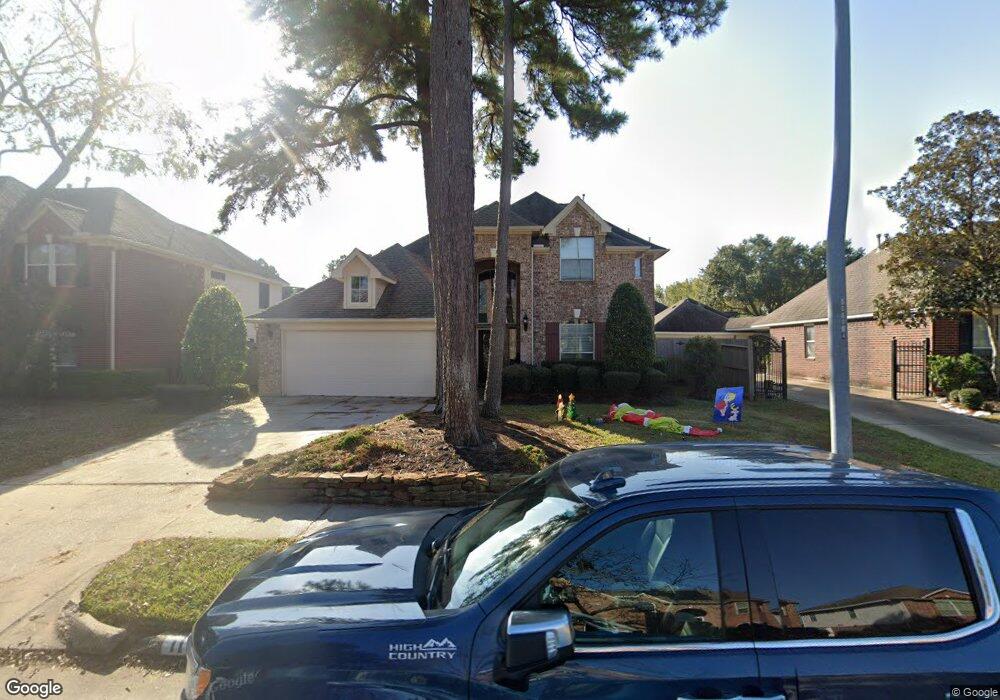
11731 Briar Canyon Ct Tomball, TX 77377
Estimated Value: $446,000 - $463,000
5
Beds
3
Baths
3,342
Sq Ft
$136/Sq Ft
Est. Value
About This Home
This home is located at 11731 Briar Canyon Ct, Tomball, TX 77377 and is currently estimated at $455,731, approximately $136 per square foot. 11731 Briar Canyon Ct is a home located in Harris County with nearby schools including Lakewood Elementary School, Willow Wood Junior High School, and Northpointe Intermediate School.
Ownership History
Date
Name
Owned For
Owner Type
Purchase Details
Closed on
Jun 25, 2012
Sold by
Antonucci Paul T and Quinn Debra
Bought by
Ervin Richard L and Ervin Teresa J
Current Estimated Value
Home Financials for this Owner
Home Financials are based on the most recent Mortgage that was taken out on this home.
Original Mortgage
$196,800
Outstanding Balance
$136,197
Interest Rate
3.8%
Mortgage Type
New Conventional
Estimated Equity
$319,534
Purchase Details
Closed on
Feb 27, 2003
Sold by
Dreamtech Homes Ltd
Bought by
Antonucci Paul Thomas and Antonucci Debra
Home Financials for this Owner
Home Financials are based on the most recent Mortgage that was taken out on this home.
Original Mortgage
$110,000
Interest Rate
5.86%
Purchase Details
Closed on
May 10, 2002
Sold by
Lakewood Grove Associates Ltd
Bought by
Dreamtech Homes Ltd
Create a Home Valuation Report for This Property
The Home Valuation Report is an in-depth analysis detailing your home's value as well as a comparison with similar homes in the area
Home Values in the Area
Average Home Value in this Area
Purchase History
| Date | Buyer | Sale Price | Title Company |
|---|---|---|---|
| Ervin Richard L | -- | None Available | |
| Antonucci Paul Thomas | -- | Chicago Title Insurance Co | |
| Dreamtech Homes Ltd | -- | Chicago Title Insurance Co |
Source: Public Records
Mortgage History
| Date | Status | Borrower | Loan Amount |
|---|---|---|---|
| Open | Ervin Richard L | $196,800 | |
| Previous Owner | Antonucci Paul Thomas | $110,000 |
Source: Public Records
Tax History Compared to Growth
Tax History
| Year | Tax Paid | Tax Assessment Tax Assessment Total Assessment is a certain percentage of the fair market value that is determined by local assessors to be the total taxable value of land and additions on the property. | Land | Improvement |
|---|---|---|---|---|
| 2025 | $7,485 | $436,765 | $71,552 | $365,213 |
| 2024 | $7,485 | $434,718 | $68,661 | $366,057 |
| 2023 | $7,485 | $473,076 | $61,795 | $411,281 |
| 2022 | $8,234 | $392,026 | $61,795 | $330,231 |
| 2021 | $7,897 | $316,591 | $43,365 | $273,226 |
| 2020 | $8,212 | $317,167 | $43,365 | $273,802 |
| 2019 | $8,176 | $307,488 | $41,558 | $265,930 |
| 2018 | $3,450 | $282,467 | $31,395 | $251,072 |
| 2017 | $7,498 | $282,467 | $31,395 | $251,072 |
| 2016 | $7,123 | $282,467 | $31,395 | $251,072 |
| 2015 | $5,867 | $243,938 | $31,395 | $212,543 |
| 2014 | $5,867 | $243,938 | $31,395 | $212,543 |
Source: Public Records
Map
Nearby Homes
- 16855 E Maglitto Cir
- 11814 Lake Grove Ct
- 11611 Teal Hollow Ln
- 11650 Brentcross Dr
- 16218 Jordyn Lake Dr
- 11815 Lakewood Hills Dr
- 16206 Lakewood Field Dr
- 11831 Gray Forest Trail
- 15915 Broad Oak Ct
- 15903 Heron Trail
- 17311 Elverson Oaks Dr
- 16106 Limestone Lake Dr
- 15726 Gettysburg Dr
- 16102 Buckhead Ct
- 16107 Sweetwater Fields Ln Unit B1
- 11722 Gray Forest Trail
- 16030 Summerville Lake Dr
- 17410 Pikes Peek Ct
- 11719 Lakewood Crossing Dr
- 11802 Laurel Meadow Dr
- 11727 Briar Canyon Ct
- 11735 Briar Canyon Ct
- 16222 Castlegrove Ct
- 11718 Moccasin Ct
- 11723 Briar Canyon Ct
- 11730 Briar Canyon Ct
- 16218 Castlegrove Ct
- 11726 Briar Canyon Ct
- 11722 Moccasin Ct
- 11734 Briar Canyon Ct
- 11722 Briar Canyon Ct
- 11719 Briar Canyon Ct
- 11714 Moccasin Ct
- 16214 Castlegrove Ct
- 16227 Castlegrove Ct
- 11718 Briar Canyon Ct
- 16231 Castlegrove Ct
- 11738 Briar Canyon Ct
- 16223 Castlegrove Ct
- 11715 Briar Canyon Ct