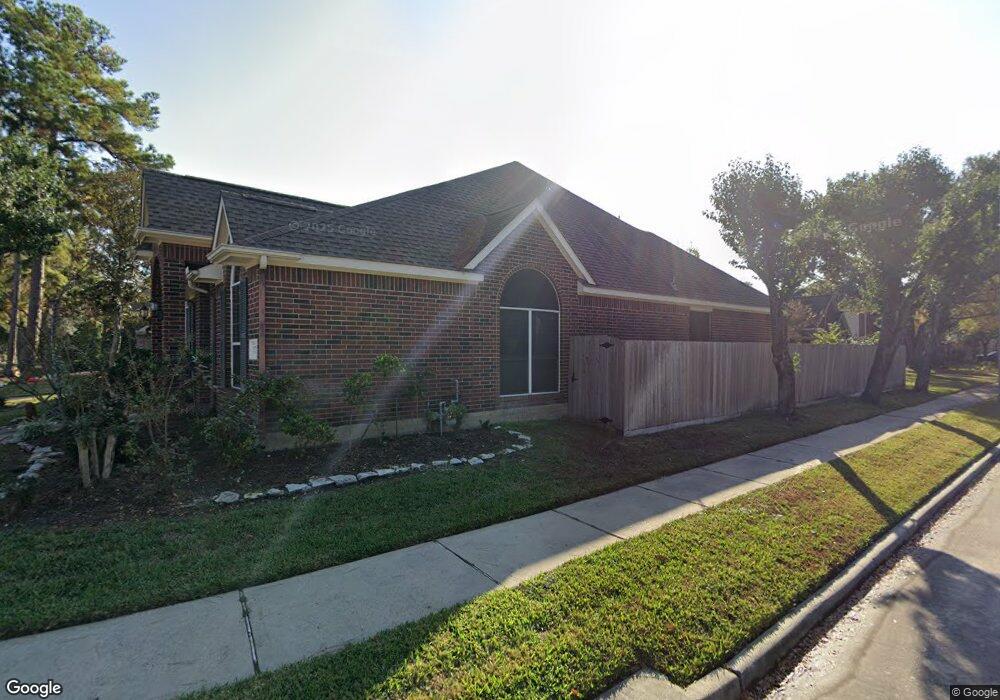
11735 Briar Canyon Ct Tomball, TX 77377
Estimated Value: $391,614 - $430,000
4
Beds
3
Baths
2,573
Sq Ft
$158/Sq Ft
Est. Value
About This Home
This home is located at 11735 Briar Canyon Ct, Tomball, TX 77377 and is currently estimated at $407,654, approximately $158 per square foot. 11735 Briar Canyon Ct is a home located in Harris County with nearby schools including Lakewood Elementary School, Willow Wood Junior High School, and Northpointe Intermediate School.
Ownership History
Date
Name
Owned For
Owner Type
Purchase Details
Closed on
Jul 31, 2015
Sold by
Fuentes Danel and Fuentes Ivonne
Bought by
Nguyen Bieu and Do Hong
Current Estimated Value
Purchase Details
Closed on
Jun 30, 2000
Sold by
David Powers Homes W O Ltd
Bought by
Fuentes Daniel and Fuentes Ivonne
Home Financials for this Owner
Home Financials are based on the most recent Mortgage that was taken out on this home.
Original Mortgage
$165,400
Interest Rate
8.66%
Purchase Details
Closed on
Jan 31, 2000
Sold by
Lakewood Grove Associates Ltd
Bought by
David Powers Homes Wo Ltd
Home Financials for this Owner
Home Financials are based on the most recent Mortgage that was taken out on this home.
Original Mortgage
$161,920
Interest Rate
7.95%
Mortgage Type
Purchase Money Mortgage
Create a Home Valuation Report for This Property
The Home Valuation Report is an in-depth analysis detailing your home's value as well as a comparison with similar homes in the area
Home Values in the Area
Average Home Value in this Area
Purchase History
| Date | Buyer | Sale Price | Title Company |
|---|---|---|---|
| Nguyen Bieu | -- | None Available | |
| Fuentes Daniel | -- | Stewart Title | |
| David Powers Homes Wo Ltd | -- | Stewart Title |
Source: Public Records
Mortgage History
| Date | Status | Borrower | Loan Amount |
|---|---|---|---|
| Previous Owner | Fuentes Daniel | $165,400 | |
| Previous Owner | David Powers Homes Wo Ltd | $161,920 |
Source: Public Records
Tax History Compared to Growth
Tax History
| Year | Tax Paid | Tax Assessment Tax Assessment Total Assessment is a certain percentage of the fair market value that is determined by local assessors to be the total taxable value of land and additions on the property. | Land | Improvement |
|---|---|---|---|---|
| 2025 | $2,261 | $398,912 | $71,552 | $327,360 |
| 2024 | $2,261 | $406,775 | $68,661 | $338,114 |
| 2023 | $2,261 | $426,053 | $61,795 | $364,258 |
| 2022 | $7,689 | $371,415 | $61,795 | $309,620 |
| 2021 | $7,375 | $295,644 | $43,365 | $252,279 |
| 2020 | $7,237 | $280,428 | $43,365 | $237,063 |
| 2019 | $6,757 | $273,362 | $41,558 | $231,804 |
| 2018 | $2,332 | $231,000 | $31,395 | $199,605 |
| 2017 | $6,132 | $231,000 | $31,395 | $199,605 |
| 2016 | $6,499 | $254,700 | $31,395 | $223,305 |
| 2015 | $6,041 | $222,565 | $31,395 | $191,170 |
| 2014 | $6,041 | $222,565 | $31,395 | $191,170 |
Source: Public Records
Map
Nearby Homes
- 11814 Lake Grove Ct
- 16855 E Maglitto Cir
- 11611 Teal Hollow Ln
- 16218 Jordyn Lake Dr
- 11650 Brentcross Dr
- 15903 Heron Trail
- 15915 Broad Oak Ct
- 11831 Gray Forest Trail
- 16206 Lakewood Field Dr
- 16106 Limestone Lake Dr
- 15726 Gettysburg Dr
- 11815 Lakewood Hills Dr
- 16107 Sweetwater Fields Ln Unit B1
- 17311 Elverson Oaks Dr
- 16030 Summerville Lake Dr
- 16102 Buckhead Ct
- 11722 Gray Forest Trail
- 16012 Summerville Lake Dr
- 11802 Laurel Meadow Dr
- 11719 Lakewood Crossing Dr
- 11731 Briar Canyon Ct
- 16222 Castlegrove Ct
- 11727 Briar Canyon Ct
- 16218 Castlegrove Ct
- 16227 Castlegrove Ct
- 11734 Briar Canyon Ct
- 11730 Briar Canyon Ct
- 16231 Castlegrove Ct
- 11718 Moccasin Ct
- 16223 Castlegrove Ct
- 11726 Briar Canyon Ct
- 11723 Briar Canyon Ct
- 11722 Moccasin Ct
- 11738 Briar Canyon Ct
- 16214 Castlegrove Ct
- 16235 Castlegrove Ct
- 16219 Castlegrove Ct
- 11722 Briar Canyon Ct
- 11719 Briar Canyon Ct
- 11714 Moccasin Ct