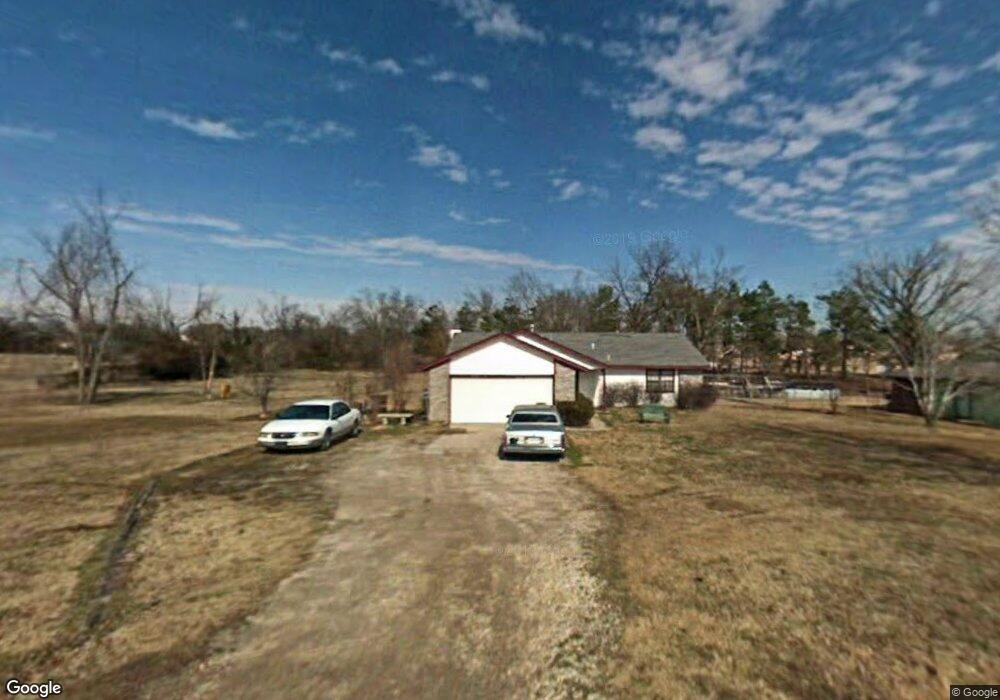
11737 E Elm St Claremore, OK 74019
Estimated Value: $210,601 - $235,000
3
Beds
2
Baths
1,242
Sq Ft
$180/Sq Ft
Est. Value
About This Home
This home is located at 11737 E Elm St, Claremore, OK 74019 and is currently estimated at $223,150, approximately $179 per square foot. 11737 E Elm St is a home located in Rogers County with nearby schools including Catalayah Elementary School, Will Rogers Junior High School, and Claremore High School.
Ownership History
Date
Name
Owned For
Owner Type
Purchase Details
Closed on
Aug 16, 2011
Sold by
Positive Properties Llc
Bought by
Davis Misty and Davis Timothy
Current Estimated Value
Home Financials for this Owner
Home Financials are based on the most recent Mortgage that was taken out on this home.
Original Mortgage
$94,940
Outstanding Balance
$65,746
Interest Rate
4.65%
Mortgage Type
FHA
Estimated Equity
$157,404
Purchase Details
Closed on
Mar 18, 2011
Sold by
Fannie Mae
Bought by
Positive Properties Llc
Purchase Details
Closed on
Aug 4, 2010
Sold by
Luce Christopher P and Luce Christopher Paul
Bought by
Federal National Mortgage Association
Purchase Details
Closed on
Oct 10, 2001
Sold by
Beck Keith W
Purchase Details
Closed on
Sep 28, 1994
Sold by
Hughes Kelly D and Hughes Kelli D
Purchase Details
Closed on
Sep 26, 1994
Sold by
Doll Kenneth H
Create a Home Valuation Report for This Property
The Home Valuation Report is an in-depth analysis detailing your home's value as well as a comparison with similar homes in the area
Home Values in the Area
Average Home Value in this Area
Purchase History
| Date | Buyer | Sale Price | Title Company |
|---|---|---|---|
| Davis Misty | $105,000 | Firstitle & Abstract Servic | |
| Positive Properties Llc | $45,500 | None Available | |
| Federal National Mortgage Association | -- | None Available | |
| -- | $88,000 | -- | |
| -- | $62,500 | -- | |
| -- | -- | -- |
Source: Public Records
Mortgage History
| Date | Status | Borrower | Loan Amount |
|---|---|---|---|
| Open | Davis Misty | $94,940 |
Source: Public Records
Tax History
| Year | Tax Paid | Tax Assessment Tax Assessment Total Assessment is a certain percentage of the fair market value that is determined by local assessors to be the total taxable value of land and additions on the property. | Land | Improvement |
|---|---|---|---|---|
| 2025 | $1,394 | $13,614 | $2,573 | $11,041 |
| 2024 | $1,265 | $13,218 | $2,498 | $10,720 |
| 2023 | $1,265 | $12,833 | $2,200 | $10,633 |
| 2022 | $1,212 | $12,678 | $2,200 | $10,478 |
| 2021 | $1,214 | $13,213 | $2,200 | $11,013 |
| 2020 | $1,222 | $13,137 | $2,200 | $10,937 |
| 2019 | $1,196 | $12,516 | $2,200 | $10,316 |
| 2018 | $1,254 | $13,111 | $2,200 | $10,911 |
| 2017 | $1,235 | $13,008 | $2,200 | $10,808 |
| 2016 | $1,320 | $12,681 | $2,200 | $10,481 |
| 2015 | $1,314 | $12,749 | $2,200 | $10,549 |
| 2014 | $1,271 | $12,341 | $2,123 | $10,218 |
Source: Public Records
Map
Nearby Homes
- 11777 E Oak St
- 11919 E Southern Hills Rd
- 10652 E Birch St
- 2500 SW Wolf Run Dr
- 10632 E Dogwood Ct
- 0 E 540 Unit 2531424
- 22037 Cliffside
- 2102 S Missouri Place
- 13126 E 510 Rd
- 2010 S Missouri Ave
- 2009 S Muskogee Place
- 13785 E 520 Rd
- 2620 S Piguet Ln
- 10754 E 530 Rd
- 24103 U S Route 66 Unit 74
- 21755 Country Ridge Ln
- 21756 S Highway 88
- 24371 S Lindley Dr
- 24465 S Orange Cove
- 2495 W Country Club Rd
- 11765 E Elm St
- 11732 E Elm St
- 11705 E Elm St
- 11776 E Elm St
- 23766 S Willow St
- 11677 E Elm St
- 11714 E Elm St
- 23732 S Willow St
- 11688 E Elm St
- 11645 E Elm St
- 11725 E Oak St
- 11745 E Oak St
- 23704 S Willow St
- 11634 E Elm St
- 11605 E Elm St
- 11722 E Southern Hills Rd
- 11673 E Oak St
- 11707 E Oak St
- 11786 E Oak St
- 23662 S Willow St
Your Personal Tour Guide
Ask me questions while you tour the home.