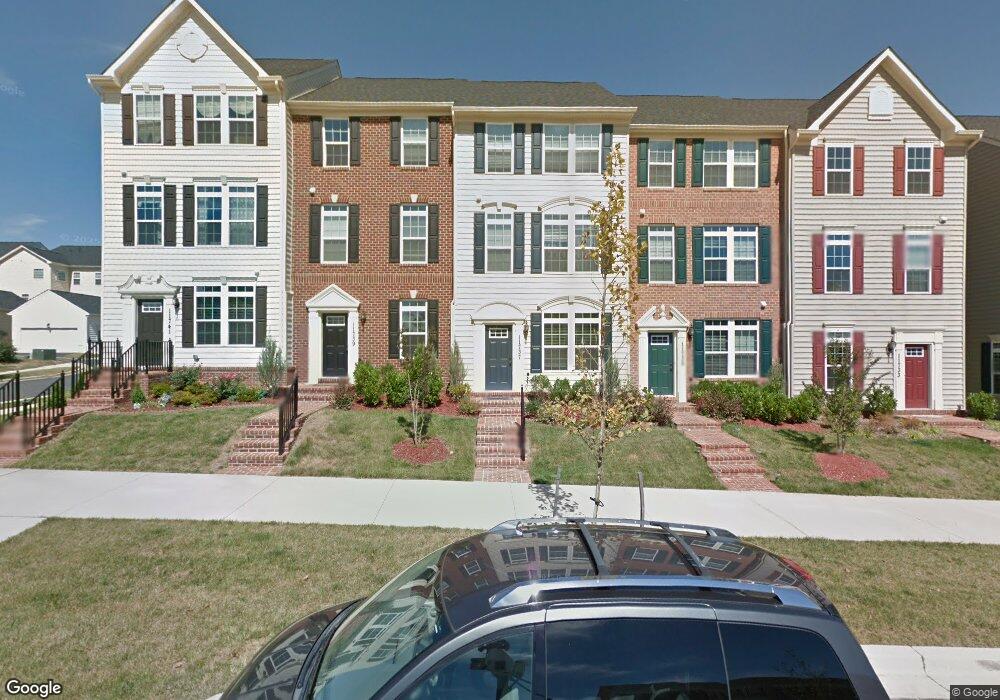
11739 Little Seneca Pkwy Clarksburg, MD 20871
Estimated Value: $277,010 - $336,000
--
Bed
1
Bath
1,296
Sq Ft
$230/Sq Ft
Est. Value
About This Home
This home is located at 11739 Little Seneca Pkwy, Clarksburg, MD 20871 and is currently estimated at $297,503, approximately $229 per square foot. 11739 Little Seneca Pkwy is a home located in Montgomery County with nearby schools including Cedar Grove Elementary School, Litchfield High School, and Hallie Wells Middle School.
Ownership History
Date
Name
Owned For
Owner Type
Purchase Details
Closed on
Aug 12, 2016
Sold by
Mele Andrew
Bought by
Zhu Jiying and Jiang Zhongtoa
Current Estimated Value
Home Financials for this Owner
Home Financials are based on the most recent Mortgage that was taken out on this home.
Original Mortgage
$163,653
Outstanding Balance
$130,323
Interest Rate
3.42%
Mortgage Type
New Conventional
Estimated Equity
$167,180
Purchase Details
Closed on
May 31, 2012
Sold by
Nvr Inc
Bought by
Mele Andrew
Home Financials for this Owner
Home Financials are based on the most recent Mortgage that was taken out on this home.
Original Mortgage
$174,400
Interest Rate
4.4%
Mortgage Type
FHA
Purchase Details
Closed on
Jan 25, 2012
Sold by
Clarksburg Skylark Llc
Bought by
Nvr Inc
Create a Home Valuation Report for This Property
The Home Valuation Report is an in-depth analysis detailing your home's value as well as a comparison with similar homes in the area
Home Values in the Area
Average Home Value in this Area
Purchase History
| Date | Buyer | Sale Price | Title Company |
|---|---|---|---|
| Zhu Jiying | $204,566 | Attorney | |
| Mele Andrew | $178,937 | Stewart Title Guaranty Co | |
| Nvr Inc | $100,000 | None Available |
Source: Public Records
Mortgage History
| Date | Status | Borrower | Loan Amount |
|---|---|---|---|
| Open | Zhu Jiying | $163,653 | |
| Previous Owner | Mele Andrew | $174,400 |
Source: Public Records
Tax History Compared to Growth
Tax History
| Year | Tax Paid | Tax Assessment Tax Assessment Total Assessment is a certain percentage of the fair market value that is determined by local assessors to be the total taxable value of land and additions on the property. | Land | Improvement |
|---|---|---|---|---|
| 2025 | $3,235 | $246,500 | $30,000 | $216,500 |
| 2024 | $3,235 | $250,100 | $30,000 | $220,100 |
| 2023 | $2,353 | $235,233 | $0 | $0 |
| 2022 | $2,067 | $220,367 | $0 | $0 |
| 2021 | $1,831 | $205,500 | $30,000 | $175,500 |
| 2020 | $1,831 | $205,300 | $0 | $0 |
| 2019 | $1,817 | $205,100 | $0 | $0 |
| 2018 | $1,811 | $204,900 | $30,000 | $174,900 |
| 2017 | $1,852 | $204,900 | $0 | $0 |
| 2016 | -- | $204,900 | $0 | $0 |
| 2015 | $32 | $210,500 | $0 | $0 |
| 2014 | $32 | $208,633 | $0 | $0 |
Source: Public Records
Map
Nearby Homes
- 22926 Spicebush Dr Unit 1632
- 22834 Arora Hills Dr Unit 120
- 11519 Elk Horn Dr
- 22327 Cabin Branch Ave
- 22608 Sweetspire Dr
- 22448 Bright Sky Dr
- 22649 Majestic Elm Ct
- 23059 Winged Elm Dr
- 12340 Juniper Blossom Place
- 12336 Juniper Blossom Place
- 11719 Emerald Green Dr Unit 904C
- 22363 Sweetspire Dr
- 12344 Cherry Branch Dr
- 12318 Cherry Branch Dr
- 12313 Cherry Branch Dr
- 11902 Piedmont Rd
- 832 Butterfly Weed Dr
- 12208 W Old Baltimore Rd
- 21822 Boneset Way
- 12301 Dancrest Dr
- 11737 Little Seneca Pkwy
- 11741 Little Seneca Pkwy
- 11735 Little Seneca Pkwy
- 11733 Little Seneca Pkwy
- 11731 Little Seneca Pkwy
- 11729 Little Seneca Pkwy
- 11847 Little Seneca Pkwy
- 11832 Little Seneca Pkwy Unit 1201
- 11820 Little Seneca Pkwy Unit 1171
- 11727 Little Seneca Pkwy
- 11834 Little Seneca Pkwy Unit 1202
- 11838 Little Seneca Pkwy
- 11838 Little Seneca Pkwy Unit 1212
- 11814 Steeplebush Dr
- 11840 Little Seneca Pkwy Unit 1221
- 11849 Little Seneca Pkwy
- 11812 Steeplebush Dr
- 11816 Steeplebush Dr
- 11725 Little Seneca Pkwy
- 11851 Little Seneca Pkwy