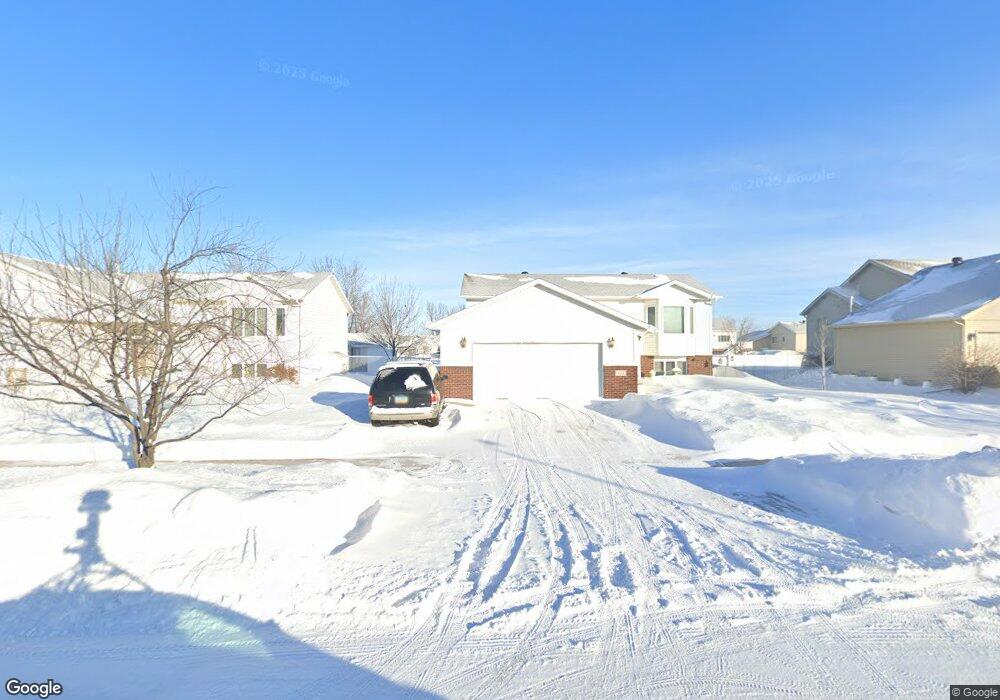
1174 7th Ave W West Fargo, ND 58078
Westwynd NeighborhoodEstimated Value: $274,000 - $319,048
4
Beds
2
Baths
2,250
Sq Ft
$132/Sq Ft
Est. Value
About This Home
This home is located at 1174 7th Ave W, West Fargo, ND 58078 and is currently estimated at $296,524, approximately $131 per square foot. 1174 7th Ave W is a home located in Cass County with nearby schools including Westside Elementary School, Cheney Middle School, and West Fargo High School.
Ownership History
Date
Name
Owned For
Owner Type
Purchase Details
Closed on
Jun 16, 2023
Sold by
Christianson Derek and Christianson Jennifer
Bought by
Meester Properties Llc
Current Estimated Value
Home Financials for this Owner
Home Financials are based on the most recent Mortgage that was taken out on this home.
Original Mortgage
$207,000
Outstanding Balance
$194,616
Interest Rate
6.39%
Mortgage Type
New Conventional
Estimated Equity
$101,908
Purchase Details
Closed on
Apr 9, 2010
Sold by
Kjensrud Sheri Ann and Tomaszewski Sheri Ann
Bought by
Tomaszewski Timothy Louis
Purchase Details
Closed on
Feb 4, 2006
Sold by
Pella Timothy L and Pella Anette M
Bought by
Tomaszewski Timothy L and Tomaszewski Sheri A
Home Financials for this Owner
Home Financials are based on the most recent Mortgage that was taken out on this home.
Original Mortgage
$176,500
Interest Rate
6.37%
Mortgage Type
New Conventional
Create a Home Valuation Report for This Property
The Home Valuation Report is an in-depth analysis detailing your home's value as well as a comparison with similar homes in the area
Home Values in the Area
Average Home Value in this Area
Purchase History
| Date | Buyer | Sale Price | Title Company |
|---|---|---|---|
| Meester Properties Llc | $276,000 | The Title Company | |
| Tomaszewski Timothy Louis | -- | -- | |
| Tomaszewski Timothy L | -- | -- |
Source: Public Records
Mortgage History
| Date | Status | Borrower | Loan Amount |
|---|---|---|---|
| Open | Meester Properties Llc | $207,000 | |
| Previous Owner | Tomaszewski Timothy L | $176,500 |
Source: Public Records
Tax History Compared to Growth
Tax History
| Year | Tax Paid | Tax Assessment Tax Assessment Total Assessment is a certain percentage of the fair market value that is determined by local assessors to be the total taxable value of land and additions on the property. | Land | Improvement |
|---|---|---|---|---|
| 2024 | $4,047 | $139,950 | $22,400 | $117,550 |
| 2023 | $4,002 | $137,850 | $22,400 | $115,450 |
| 2022 | $3,942 | $130,000 | $22,400 | $107,600 |
| 2021 | $3,834 | $121,800 | $20,550 | $101,250 |
| 2020 | $3,564 | $115,350 | $20,550 | $94,800 |
| 2019 | $3,474 | $112,000 | $20,550 | $91,450 |
| 2018 | $3,338 | $112,000 | $20,550 | $91,450 |
| 2017 | $3,142 | $111,100 | $20,550 | $90,550 |
| 2016 | $2,652 | $107,800 | $20,550 | $87,250 |
| 2015 | $2,547 | $95,100 | $11,850 | $83,250 |
| 2014 | $2,493 | $88,900 | $11,850 | $77,050 |
| 2013 | $2,407 | $86,650 | $11,850 | $74,800 |
Source: Public Records
Map
Nearby Homes
- 1166 7th Ave W
- 1182 7th Ave W
- 1175 6th Ave W
- 1158 7th Ave W
- 1167 6th Ave W
- 1173 7th Ave W
- 1159 6th Ave W
- 1165 7th Ave W
- 1181 7th Ave W
- 1150 7th Ave W
- 1157 7th Ave W
- 1151 6th Ave W
- 636 Westwynd Dr
- 620 Westwynd Dr
- 644 Westwynd Dr
- 1142 7th Ave W
- 1149 7th Ave W
- 612 Westwynd Dr
- 708 Westwynd Dr
- 1172 8th Ave W