Estimated Value: $163,488 - $452,000
Studio
1
Bath
1,735
Sq Ft
$178/Sq Ft
Est. Value
About This Home
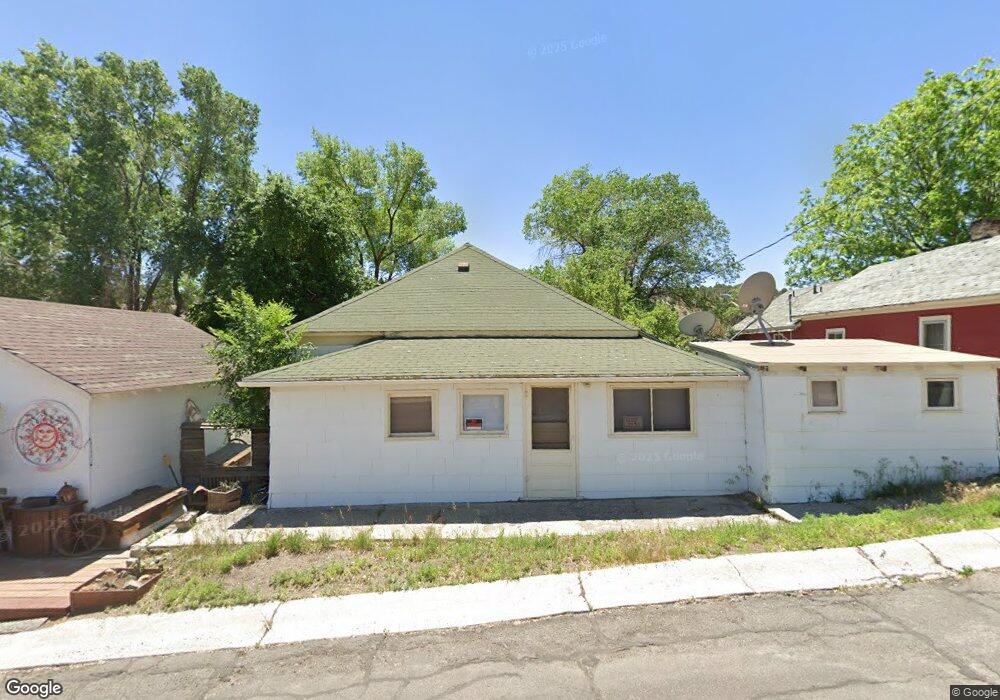
This home is located at 1174 Lyons Ave, Ely, NV 89301 and is currently estimated at $309,372, approximately $178 per square foot. 1174 Lyons Ave is a home located in White Pine County with nearby schools including David E. Norman Elementary School, White Pine Middle School, and White Pine High School.
Ownership History
Date
Name
Owned For
Owner Type
Purchase Details
Closed on
Nov 20, 2009
Sold by
Morgenstern Steven L
Bought by
Morgenstern Steven L and Quindoy Emlyn
Current Estimated Value
Purchase Details
Closed on
Jun 15, 2005
Sold by
Sec Of Housing & Urban Development
Bought by
Morgenstern Steve
Home Financials for this Owner
Home Financials are based on the most recent Mortgage that was taken out on this home.
Original Mortgage
$34,000
Interest Rate
5.72%
Create a Home Valuation Report for This Property
The Home Valuation Report is an in-depth analysis detailing your home's value as well as a comparison with similar homes in the area
Home Values in the Area
Average Home Value in this Area
Purchase History
| Date | Buyer | Sale Price | Title Company |
|---|---|---|---|
| Morgenstern Steven L | -- | -- | |
| Morgenstern Steve | $42,500 | -- |
Source: Public Records
Mortgage History
| Date | Status | Borrower | Loan Amount |
|---|---|---|---|
| Previous Owner | Morgenstern Steve | $34,000 |
Source: Public Records
Tax History
| Year | Tax Paid | Tax Assessment Tax Assessment Total Assessment is a certain percentage of the fair market value that is determined by local assessors to be the total taxable value of land and additions on the property. | Land | Improvement |
|---|---|---|---|---|
| 2025 | $1,184 | $31,528 | $6,055 | $25,473 |
| 2024 | $1,184 | $30,521 | $5,425 | $25,096 |
| 2023 | $1,184 | $28,138 | $5,425 | $22,713 |
| 2022 | $882 | $22,121 | $4,725 | $17,396 |
| 2021 | $840 | $20,993 | $4,725 | $16,268 |
| 2020 | $853 | $21,347 | $4,725 | $16,622 |
| 2019 | $817 | $20,349 | $4,725 | $15,624 |
| 2018 | $797 | $19,804 | $4,725 | $15,079 |
| 2017 | $679 | $18,952 | $4,305 | $14,647 |
| 2016 | $659 | $17,859 | $4,305 | $13,554 |
| 2015 | $579 | $17,725 | $4,305 | $13,420 |
| 2014 | $579 | $18,267 | $5,110 | $13,157 |
Source: Public Records
Map
Nearby Homes
Your Personal Tour Guide
Ask me questions while you tour the home.