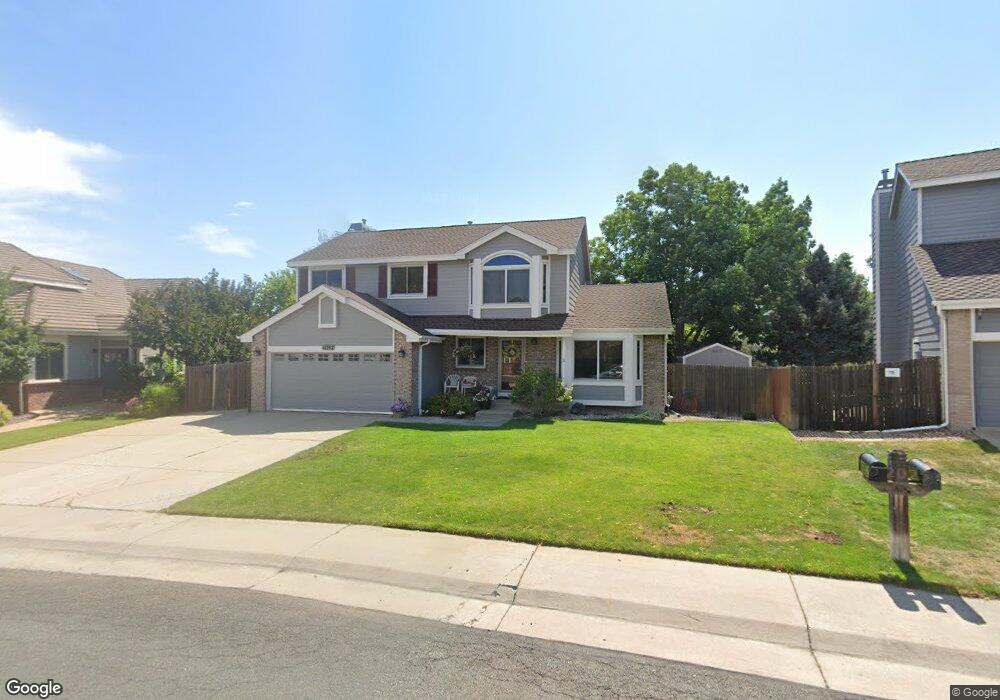
11742 W 56th Cir Arvada, CO 80002
Rainbow Ridge NeighborhoodEstimated Value: $785,000 - $826,505
5
Beds
3
Baths
2,834
Sq Ft
$287/Sq Ft
Est. Value
About This Home
This home is located at 11742 W 56th Cir, Arvada, CO 80002 and is currently estimated at $812,626, approximately $286 per square foot. 11742 W 56th Cir is a home located in Jefferson County with nearby schools including Vanderhoof Elementary School, Drake Junior High School, and Arvada West High School.
Ownership History
Date
Name
Owned For
Owner Type
Purchase Details
Closed on
Jun 5, 2017
Sold by
Fuller Joseph and Fuller Corrina
Bought by
Velisek Sean M and Velisek Ellen L
Current Estimated Value
Home Financials for this Owner
Home Financials are based on the most recent Mortgage that was taken out on this home.
Original Mortgage
$399,000
Outstanding Balance
$331,976
Interest Rate
4.03%
Mortgage Type
New Conventional
Estimated Equity
$480,650
Purchase Details
Closed on
Jan 31, 2013
Sold by
Hastings Thomas A and Hastings Eileen
Bought by
Fuller Joseph and Fuller Corrina
Home Financials for this Owner
Home Financials are based on the most recent Mortgage that was taken out on this home.
Original Mortgage
$308,655
Interest Rate
3.42%
Mortgage Type
New Conventional
Purchase Details
Closed on
Jan 14, 1994
Sold by
Sheffield Homes Ltd
Bought by
Hastings Thomas A and Hastings Eileen
Home Financials for this Owner
Home Financials are based on the most recent Mortgage that was taken out on this home.
Original Mortgage
$123,450
Interest Rate
7.23%
Create a Home Valuation Report for This Property
The Home Valuation Report is an in-depth analysis detailing your home's value as well as a comparison with similar homes in the area
Home Values in the Area
Average Home Value in this Area
Purchase History
| Date | Buyer | Sale Price | Title Company |
|---|---|---|---|
| Velisek Sean M | $509,000 | Chicago Title Co | |
| Fuller Joseph | $324,900 | Land Title Guarantee Company | |
| Hastings Thomas A | $154,345 | -- |
Source: Public Records
Mortgage History
| Date | Status | Borrower | Loan Amount |
|---|---|---|---|
| Open | Velisek Sean M | $399,000 | |
| Previous Owner | Fuller Joseph | $308,655 | |
| Previous Owner | Hastings Thomas A | $123,450 |
Source: Public Records
Tax History Compared to Growth
Tax History
| Year | Tax Paid | Tax Assessment Tax Assessment Total Assessment is a certain percentage of the fair market value that is determined by local assessors to be the total taxable value of land and additions on the property. | Land | Improvement |
|---|---|---|---|---|
| 2024 | $4,615 | $47,578 | $24,467 | $23,111 |
| 2023 | $4,615 | $47,578 | $24,467 | $23,111 |
| 2022 | $4,023 | $41,079 | $18,452 | $22,627 |
| 2021 | $4,090 | $42,261 | $18,983 | $23,278 |
| 2020 | $3,590 | $37,204 | $16,024 | $21,180 |
| 2019 | $3,542 | $37,204 | $16,024 | $21,180 |
| 2018 | $3,296 | $33,661 | $10,650 | $23,011 |
| 2017 | $3,017 | $33,661 | $10,650 | $23,011 |
| 2016 | $2,947 | $30,606 | $8,326 | $22,280 |
| 2015 | $2,510 | $30,606 | $8,326 | $22,280 |
| 2014 | $2,510 | $24,789 | $8,574 | $16,215 |
Source: Public Records
Map
Nearby Homes
- 11873 W 56th Cir
- 11958 W 57th Place
- 11237 W 55th Ln
- 11201 W 53rd Dr
- The SIXTEEN Plan at Sabell - Townhomes
- The NINETEEN Plan at Sabell - Townhomes
- 11924 W 57th Dr
- 11944 W 57th Dr
- 5779 Taft St
- 5240 Routt Ct Unit B
- 11205 W 53rd Ln
- 5368 Quail St
- 5387 Pierson Ct
- 5738 Urban Center
- 5293 Quail Way
- 5182 Rob Way
- Haskins Station Plan at Haskins Station
- Plan 133 at Haskins Station
- Plan 132 at Haskins Station
- Plan 122 at Haskins Station
- 11732 W 56th Cir
- 11752 W 56th Cir
- 11722 W 56th Cir
- 11762 W 56th Cir
- 11753 W 56th Cir
- 11733 W 56th Cir
- 11712 W 56th Cir
- 11773 W 56th Cir
- 11772 W 56th Cir
- 11713 W 56th Cir
- 11702 W 56th Cir
- 5622 Tabor Ct
- 5612 Tabor Ct
- 11793 W 56th Cir
- 11782 W 56th Cir
- 11703 W 56th Cir
- 5632 Tabor Ct
- 11792 W 56th Cir
- 11803 W 56th Cir
- 5642 Tabor Ct