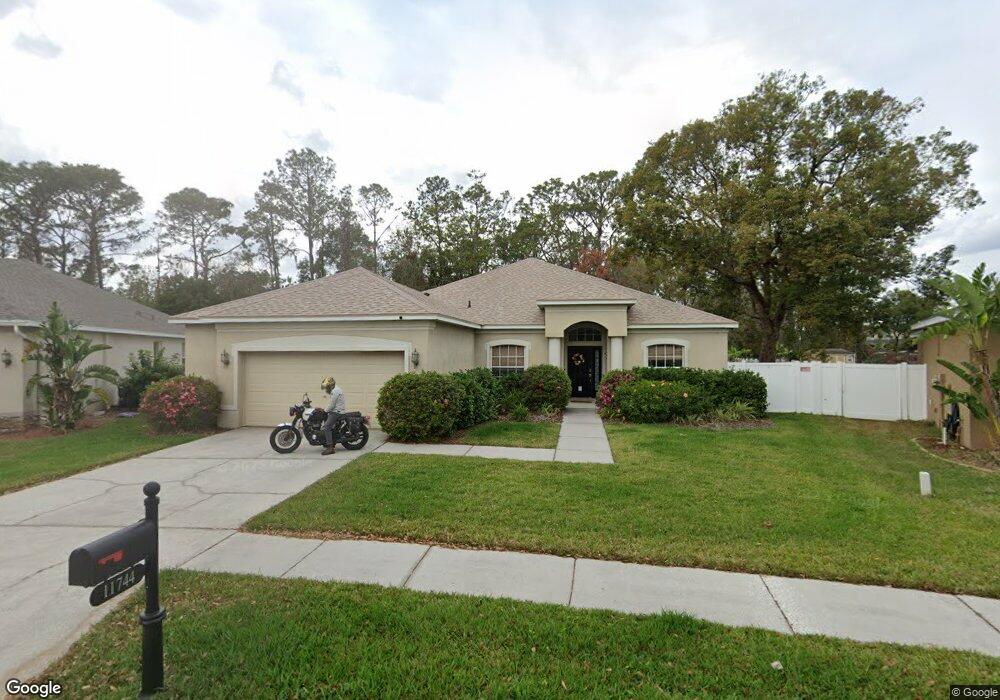
11744 Summer Springs Dr Riverview, FL 33579
Estimated Value: $420,000 - $436,000
4
Beds
3
Baths
2,233
Sq Ft
$191/Sq Ft
Est. Value
About This Home
This home is located at 11744 Summer Springs Dr, Riverview, FL 33579 and is currently estimated at $426,569, approximately $191 per square foot. 11744 Summer Springs Dr is a home located in Hillsborough County with nearby schools including Summerfield Elementary School, Riverview High School, and Southshore Charter Academy.
Ownership History
Date
Name
Owned For
Owner Type
Purchase Details
Closed on
Mar 22, 2024
Sold by
Aarons James A
Bought by
James Aarons Revocable Trust and Aarons
Current Estimated Value
Purchase Details
Closed on
Aug 6, 2014
Sold by
Bullard Scott and Bullard Teri
Bought by
Aarons James A
Home Financials for this Owner
Home Financials are based on the most recent Mortgage that was taken out on this home.
Original Mortgage
$196,377
Interest Rate
4.12%
Mortgage Type
FHA
Purchase Details
Closed on
Jul 27, 2005
Sold by
Paragon Homes Corp
Bought by
Bullard Scott and Bullard Teri
Home Financials for this Owner
Home Financials are based on the most recent Mortgage that was taken out on this home.
Original Mortgage
$70,000
Interest Rate
5.5%
Mortgage Type
Fannie Mae Freddie Mac
Create a Home Valuation Report for This Property
The Home Valuation Report is an in-depth analysis detailing your home's value as well as a comparison with similar homes in the area
Home Values in the Area
Average Home Value in this Area
Purchase History
| Date | Buyer | Sale Price | Title Company |
|---|---|---|---|
| James Aarons Revocable Trust | -- | None Listed On Document | |
| Aarons James A | $200,000 | Affinity Title Agency Inc | |
| Bullard Scott | $239,300 | First American Title Ins Co |
Source: Public Records
Mortgage History
| Date | Status | Borrower | Loan Amount |
|---|---|---|---|
| Previous Owner | Aarons James A | $196,377 | |
| Previous Owner | Bullard Scott | $70,000 |
Source: Public Records
Tax History Compared to Growth
Tax History
| Year | Tax Paid | Tax Assessment Tax Assessment Total Assessment is a certain percentage of the fair market value that is determined by local assessors to be the total taxable value of land and additions on the property. | Land | Improvement |
|---|---|---|---|---|
| 2024 | $3,841 | $213,847 | -- | -- |
| 2023 | $3,701 | $207,618 | $0 | $0 |
| 2022 | $3,526 | $201,571 | $0 | $0 |
| 2021 | $3,485 | $195,700 | $0 | $0 |
| 2020 | $3,396 | $192,998 | $0 | $0 |
| 2019 | $3,292 | $188,659 | $0 | $0 |
| 2018 | $3,237 | $185,141 | $0 | $0 |
| 2017 | $3,193 | $203,237 | $0 | $0 |
| 2016 | $3,163 | $177,603 | $0 | $0 |
| 2015 | $3,194 | $176,368 | $0 | $0 |
| 2014 | $2,192 | $125,138 | $0 | $0 |
| 2013 | -- | $123,289 | $0 | $0 |
Source: Public Records
Map
Nearby Homes
- 11749 Summer Springs Dr
- 11738 Summer Springs Dr
- 11845 Newberry Grove Loop
- 11807 Harpswell Dr
- 11729 Newberry Grove Loop
- 12807 Balm Riverview Rd Unit A
- 12906 Cattail Shore Ln
- 11890 Frost Aster Dr
- 11851 Frost Aster Dr
- 11721 Gilmerton Dr
- 11924 Frost Aster Dr
- 11929 Frost Aster Dr
- 12625 Belcroft Dr
- 11831 Cross Vine Dr
- 12669 Belcroft Dr
- 12125 Buffington Ln
- 12637 Belcroft Dr
- 11906 Climbing Fern Ave
- 11807 Cross Vine Dr
- 12646 Belcroft Dr
- 11746 Summer Springs Dr
- 11742 Summer Springs Dr
- 11748 Summer Springs Dr
- 11740 Summer Springs Dr
- 11750 Summer Springs Dr
- 11751 Summer Springs Dr
- 11811 Newberry Grove Loop
- 11813 Newberry Grove Loop
- 11739 Summer Springs Dr
- 11752 Summer Springs Dr
- 11809 Newberry Grove Loop
- 11753 Summer Springs Dr
- 11736 Summer Springs Dr
- 11815 Newberry Grove Loop
- 11754 Summer Springs Dr
- 11807 Newberry Grove Loop
- 11737 Summer Springs Dr
- 11773 Summer Springs Dr
- 11755 Summer Springs Dr
- 11817 Newberry Grove Loop