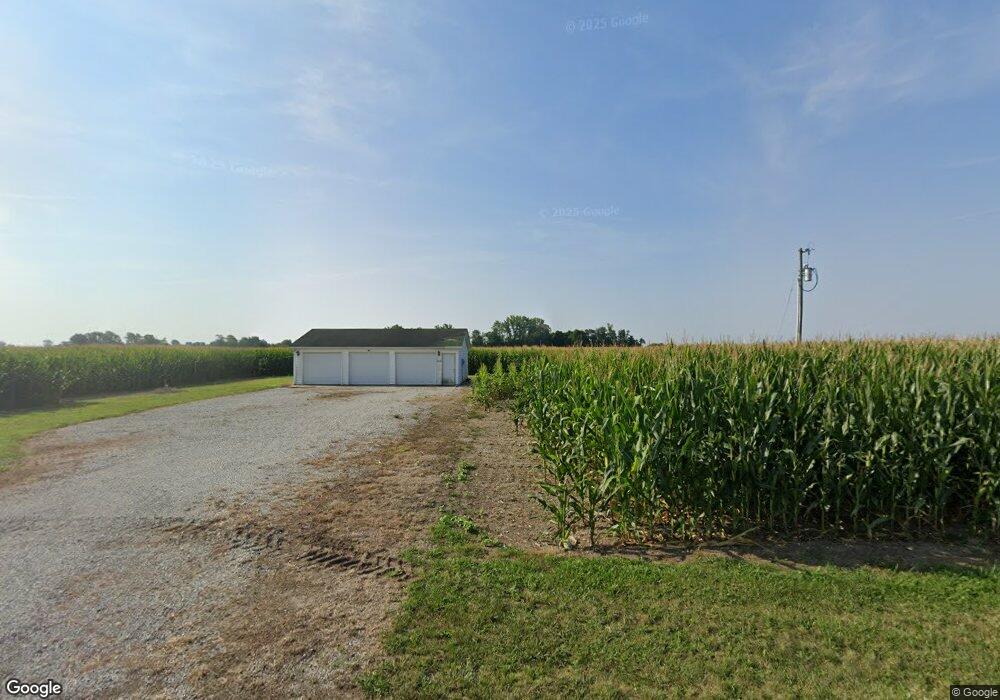
11747 W 150 N Kempton, IN 46049
Estimated Value: $158,518 - $229,000
4
Beds
2
Baths
2,178
Sq Ft
$89/Sq Ft
Est. Value
About This Home
This home is located at 11747 W 150 N, Kempton, IN 46049 and is currently estimated at $193,759, approximately $88 per square foot. 11747 W 150 N is a home located in Tipton County with nearby schools including Tri Central Elementary School and Tri Central Middle/High School.
Ownership History
Date
Name
Owned For
Owner Type
Purchase Details
Closed on
Sep 23, 2016
Sold by
Amy L Merlin
Bought by
Mark A Bell
Current Estimated Value
Purchase Details
Closed on
Jan 15, 2016
Sold by
Fifth Third Mortgage Company
Bought by
Merlin Amy L
Purchase Details
Closed on
Oct 3, 2013
Sold by
John R Moses Sheriff Of Tipto
Bought by
Fifth Third Mortgage Company M
Purchase Details
Closed on
Jul 28, 2009
Sold by
Star Financial Bank Star Financial Bank
Bought by
Federal National Mortgage Federal Nation
Purchase Details
Closed on
Jul 13, 2009
Sold by
Frank L Fritch
Bought by
Star Financial Bank
Create a Home Valuation Report for This Property
The Home Valuation Report is an in-depth analysis detailing your home's value as well as a comparison with similar homes in the area
Purchase History
| Date | Buyer | Sale Price | Title Company |
|---|---|---|---|
| Mark A Bell | $4,400 | Brooke/ Stevens, P.C. | |
| Merlin Amy L | $20,000 | Serviceline | |
| Fifth Third Mortgage Company M | $76,000 | Manley Deas Kochalski Llc | |
| Federal National Mortgage Federal Nation | $175,200 | Unterberg & Associates, P.C. | |
| Star Financial Bank | $175,200 | Unterberg & Associates, P.C. |
Source: Public Records
Tax History
| Year | Tax Paid | Tax Assessment Tax Assessment Total Assessment is a certain percentage of the fair market value that is determined by local assessors to be the total taxable value of land and additions on the property. | Land | Improvement |
|---|---|---|---|---|
| 2024 | $246 | $16,600 | $4,100 | $12,500 |
| 2023 | $224 | $15,900 | $3,400 | $12,500 |
| 2022 | $191 | $15,200 | $2,700 | $12,500 |
| 2021 | $212 | $13,200 | $2,300 | $10,900 |
| 2020 | $638 | $43,800 | $25,800 | $18,000 |
| 2019 | $680 | $42,900 | $26,200 | $16,700 |
| 2018 | $691 | $43,700 | $26,300 | $17,400 |
| 2017 | $652 | $42,900 | $26,600 | $16,300 |
| 2016 | $1,139 | $77,900 | $26,800 | $51,100 |
| 2014 | $1,111 | $77,000 | $26,900 | $50,100 |
| 2013 | $1,111 | $121,200 | $26,500 | $94,700 |
Source: Public Records
Map
Nearby Homes
- 1770 N 1000 W
- 305 N Pike St
- 201 W Colonial St
- **** **** N Co Road 1380 E
- *** *** N Co Road 1380 E
- *** ** ** N Co Road 1380 E
- 11888 W 600 N
- 104 S State St
- 10320 W 650 N
- 8994 E Hillis St
- 3492 W 500 S
- 5835 W Division Rd
- 1819 N County Road 830 E
- 4540 S County Road 1400 E
- 1709 Bramoor Dr
- 8303 W 400 S
- 6349 W 350 S
- 5872 W 550 N
- 4251 Coventry Dr
- 4156 Sheffield Cir
Your Personal Tour Guide
Ask me questions while you tour the home.