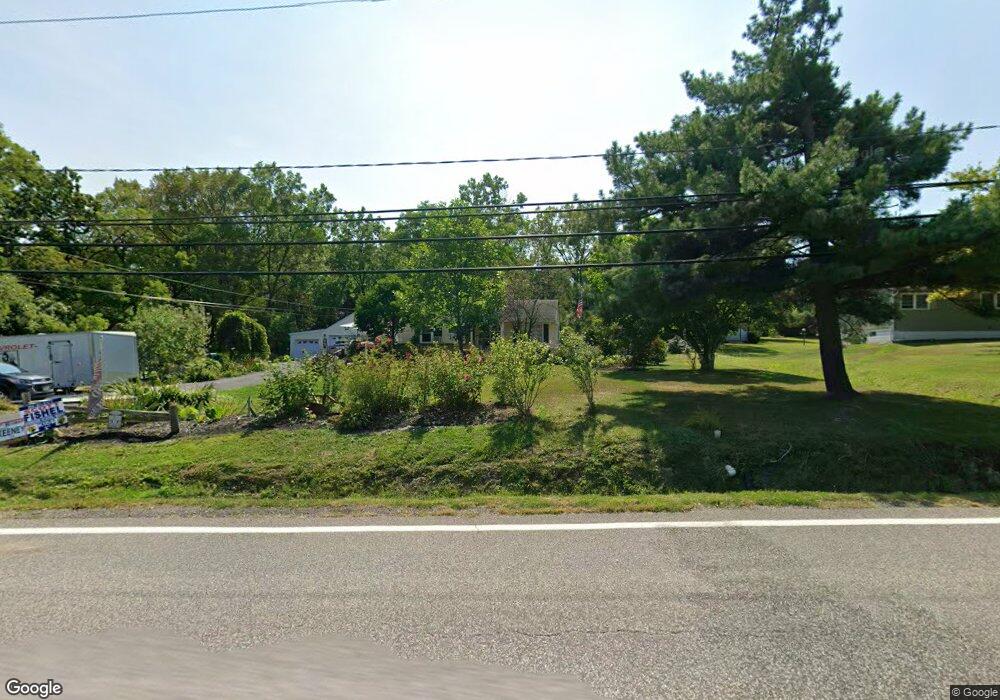
11748 Concord Hambden Rd Concord Township, OH 44077
Estimated Value: $213,184 - $331,000
3
Beds
1
Bath
1,060
Sq Ft
$254/Sq Ft
Est. Value
About This Home
This home is located at 11748 Concord Hambden Rd, Concord Township, OH 44077 and is currently estimated at $269,296, approximately $254 per square foot. 11748 Concord Hambden Rd is a home located in Lake County with nearby schools including Henry F. Lamuth Middle School, Riverside Junior/Senior High School, and The Goddard School - Concord Township.
Ownership History
Date
Name
Owned For
Owner Type
Purchase Details
Closed on
Jul 31, 2010
Sold by
Heigley Joel D and Heigley Alicia A
Bought by
Gyure Sandra L
Current Estimated Value
Home Financials for this Owner
Home Financials are based on the most recent Mortgage that was taken out on this home.
Original Mortgage
$152,200
Outstanding Balance
$110,246
Interest Rate
4.81%
Mortgage Type
Purchase Money Mortgage
Estimated Equity
$159,050
Purchase Details
Closed on
Sep 18, 2000
Sold by
Spence David E and Spence Marilyn J
Bought by
Heigley Joel D and Heigley Alicia A
Home Financials for this Owner
Home Financials are based on the most recent Mortgage that was taken out on this home.
Original Mortgage
$126,500
Interest Rate
8.05%
Mortgage Type
Purchase Money Mortgage
Purchase Details
Closed on
Jun 16, 1992
Bought by
Spence David E
Create a Home Valuation Report for This Property
The Home Valuation Report is an in-depth analysis detailing your home's value as well as a comparison with similar homes in the area
Home Values in the Area
Average Home Value in this Area
Purchase History
| Date | Buyer | Sale Price | Title Company |
|---|---|---|---|
| Gyure Sandra L | $152,200 | Chicago Title Insurance Co | |
| Heigley Joel D | $136,500 | Midland Title Security Inc | |
| Spence David E | -- | -- |
Source: Public Records
Mortgage History
| Date | Status | Borrower | Loan Amount |
|---|---|---|---|
| Open | Gyure Sandra L | $152,200 | |
| Previous Owner | Heigley Joel D | $126,500 |
Source: Public Records
Tax History Compared to Growth
Tax History
| Year | Tax Paid | Tax Assessment Tax Assessment Total Assessment is a certain percentage of the fair market value that is determined by local assessors to be the total taxable value of land and additions on the property. | Land | Improvement |
|---|---|---|---|---|
| 2024 | -- | $67,300 | $31,470 | $35,830 |
| 2023 | $5,272 | $54,590 | $26,220 | $28,370 |
| 2022 | $2,872 | $54,590 | $26,220 | $28,370 |
| 2021 | $2,883 | $54,590 | $26,220 | $28,370 |
| 2020 | $2,710 | $45,490 | $21,850 | $23,640 |
| 2019 | $2,706 | $45,490 | $21,850 | $23,640 |
| 2018 | $2,715 | $38,520 | $18,520 | $20,000 |
| 2017 | $2,431 | $38,520 | $18,520 | $20,000 |
| 2016 | $2,234 | $38,520 | $18,520 | $20,000 |
| 2015 | $2,078 | $38,520 | $18,520 | $20,000 |
| 2014 | $1,983 | $36,840 | $18,520 | $18,320 |
| 2013 | $1,983 | $36,840 | $18,520 | $18,320 |
Source: Public Records
Map
Nearby Homes
- 7391 Far Hill Dr
- 7305 Alexander Rd
- 7234 Bridlewood Dr
- 7450 Nancy Ann Dr
- 12000 Concord Hambden Rd
- 11579 Olde Stone Ct
- 11390 Labrador Ln
- 7280 Hunters Trail
- 7807 Hunting Lake Dr
- 11440 Somerset Trail
- 7818 Hunting Lake Dr
- 11307 S Forest Dr Unit 3
- 11310 S Forest Dr
- 7295 Players Club Dr
- 7776 Jo Ann Dr
- 6980 Sturbridge Dr
- 12105 Girdled Rd
- 11096 Quail Hollow Dr Unit 26
- 12120 Girdled Rd
- 12066 Huntoon Rd
- 11756 Concord Hambden Rd
- 11758 Concord Hambden Rd
- 11741 Christian Ave
- 11741 Christian Ave Unit 44
- 11751 Christian Ave
- 11712 Concord Hambden Rd
- 11741 Concord Hambden Rd
- 11731 Christian Ave
- 11761 Christian Ave
- 11786 Concord Hambden Rd
- 11721 Concord Hambden Rd
- 11751 Concord Hambden Rd
- 11731 Concord Hambden Rd
- 11771 Christian Ave
- 35 Christian Ave
- 35 SL Christian Ave
- 11781 Concord Hambden Rd
- 11707 Concord Hambden Rd
- 11702 Concord Hambden Rd
- 11781 Christian Ave