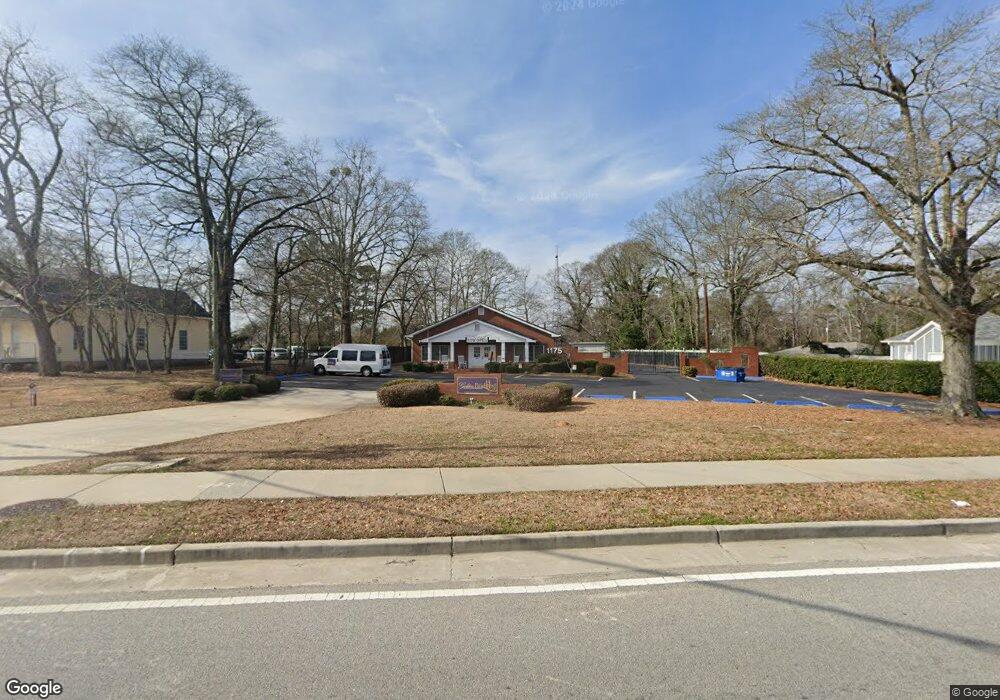
1175 Green St SE Conyers, GA 30012
Estimated Value: $617,830
--
Bed
--
Bath
3,570
Sq Ft
$173/Sq Ft
Est. Value
About This Home
This home is located at 1175 Green St SE, Conyers, GA 30012 and is currently estimated at $617,830, approximately $173 per square foot. 1175 Green St SE is a home located in Rockdale County with nearby schools including Hicks Elementary School, Edwards Middle School, and Salem High School.
Ownership History
Date
Name
Owned For
Owner Type
Purchase Details
Closed on
Jul 24, 2020
Sold by
Moseri John L
Bought by
M & S Rental Properties Llc
Current Estimated Value
Purchase Details
Closed on
Mar 21, 2014
Sold by
Hardhat Equities Llc
Bought by
Moseri John L
Purchase Details
Closed on
Apr 4, 2003
Sold by
Helms Theron J
Bought by
Hardhat Equities Llc
Home Financials for this Owner
Home Financials are based on the most recent Mortgage that was taken out on this home.
Original Mortgage
$38,500
Interest Rate
5.74%
Mortgage Type
New Conventional
Purchase Details
Closed on
Sep 22, 2000
Sold by
Johnson Charles and Johnson Jane A
Bought by
Helms Theron J
Home Financials for this Owner
Home Financials are based on the most recent Mortgage that was taken out on this home.
Original Mortgage
$407,130
Interest Rate
7.96%
Mortgage Type
New Conventional
Purchase Details
Closed on
Apr 14, 1997
Sold by
Athon Enterprises Inc
Bought by
Johnson Charles M and Johnson Jane A
Home Financials for this Owner
Home Financials are based on the most recent Mortgage that was taken out on this home.
Original Mortgage
$200,000
Interest Rate
7.85%
Mortgage Type
Commercial
Create a Home Valuation Report for This Property
The Home Valuation Report is an in-depth analysis detailing your home's value as well as a comparison with similar homes in the area
Home Values in the Area
Average Home Value in this Area
Purchase History
| Date | Buyer | Sale Price | Title Company |
|---|---|---|---|
| M & S Rental Properties Llc | $395,000 | -- | |
| Moseri John L | $240,000 | -- | |
| Hardhat Equities Llc | -- | -- | |
| Helms Theron J | $360,000 | -- | |
| Johnson Charles M | $250,000 | -- |
Source: Public Records
Mortgage History
| Date | Status | Borrower | Loan Amount |
|---|---|---|---|
| Previous Owner | Hardhat Equities Llc | $38,500 | |
| Previous Owner | Helms Theron J | $407,130 | |
| Previous Owner | Johnson Charles M | $200,000 |
Source: Public Records
Tax History Compared to Growth
Tax History
| Year | Tax Paid | Tax Assessment Tax Assessment Total Assessment is a certain percentage of the fair market value that is determined by local assessors to be the total taxable value of land and additions on the property. | Land | Improvement |
|---|---|---|---|---|
| 2024 | $10,694 | $197,232 | $56,600 | $140,632 |
| 2023 | $9,712 | $173,112 | $34,840 | $138,272 |
| 2022 | $9,504 | $168,432 | $34,840 | $133,592 |
| 2021 | $8,531 | $156,512 | $34,840 | $121,672 |
| 2020 | $6,763 | $110,112 | $34,840 | $75,272 |
| 2019 | $7,035 | $110,112 | $34,840 | $75,272 |
| 2018 | $4,828 | $107,072 | $34,840 | $72,232 |
| 2017 | $5,871 | $93,056 | $34,840 | $58,216 |
| 2016 | $5,909 | $93,056 | $34,840 | $58,216 |
| 2015 | $4,240 | $93,056 | $34,840 | $58,216 |
| 2014 | $3,594 | $78,056 | $34,840 | $43,216 |
| 2013 | -- | $96,496 | $43,560 | $52,936 |
Source: Public Records
Map
Nearby Homes
- 998 Highland Cir SE
- 997 Highland Cir SE
- 1146 Old Covington Hwy SE
- 1110 Oakland Ave SE
- 871 Malcom St SE
- 990 Oakland Ave SE
- 988 Huff St SW
- 1269 Lark Ln NE
- 1031 Pine St NE
- 214 Seward St Unit 94
- 953 Remington Dr SE
- 954 Bryant St SW
- 0 Hwy 138 Hwy Unit 20077387
- 1532 Remington Ct SE
- 948 Peek St NW
- 1065 Milstead Ave NE
- 1271 Eastview Rd NE
- 1098 Eastview Cir NE
- 1059 Green St SE
- 1031 Meadow Ln SE
- 1041 Meadow Ln SE
- 1034 Highland Cir SE
- 1028 Highland Cir SE
- 1199 Green St SE
- 1046 Highland Cir SE
- 1030 Meadow Ln SE
- 0 Highland Cir SE Unit 7172273
- 0 Highland Cir SE Unit 7241622
- 0 Highland Cir SE Unit 8699556
- 0 Highland Cir SE Unit 7084756
- 0 Highland Cir SE Unit 8814702
- 1022 Highland Cir SE
- 1047 Green St SE
- 1020 Meadow Ln SE
- 1200 Green St SE
- 1200 Green St SE
- 1050 Green St SE
- 1213 Green St SE