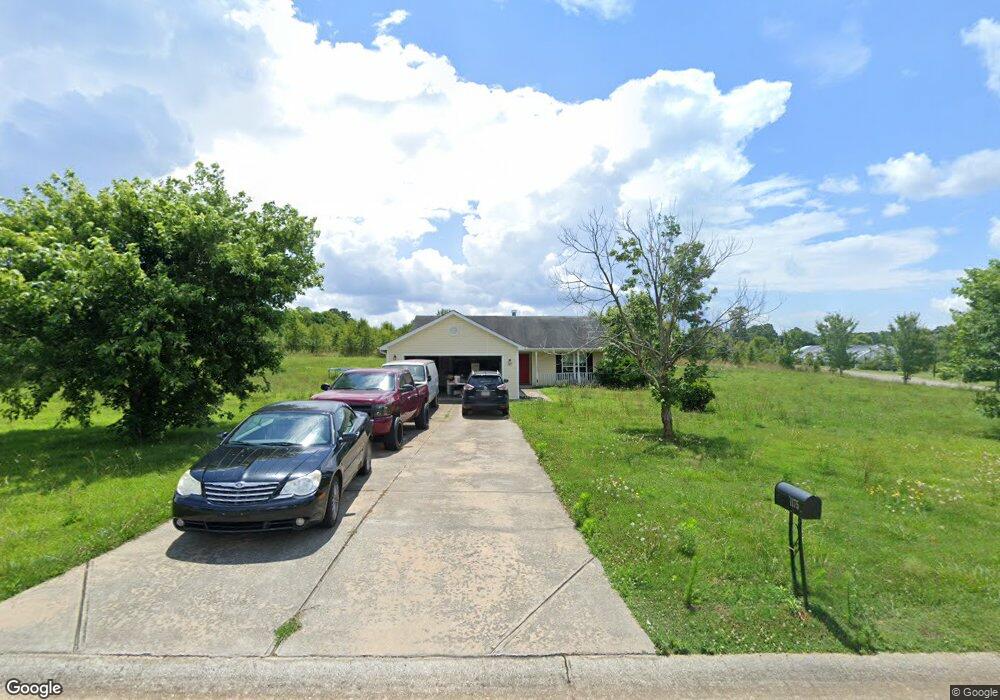
1175 Langdon Park Cir Winder, GA 30680
Estimated Value: $312,890 - $333,000
3
Beds
2
Baths
1,428
Sq Ft
$227/Sq Ft
Est. Value
About This Home
This home is located at 1175 Langdon Park Cir, Winder, GA 30680 and is currently estimated at $324,223, approximately $227 per square foot. 1175 Langdon Park Cir is a home located in Barrow County with nearby schools including Bethlehem Elementary School, Haymon-Morris Middle School, and Apalachee High School.
Ownership History
Date
Name
Owned For
Owner Type
Purchase Details
Closed on
Dec 19, 2014
Sold by
Tarbert Llc
Bought by
Sway 2014 1 Borrower Llc
Current Estimated Value
Purchase Details
Closed on
Jan 31, 2014
Sold by
Srp Sub Llc
Bought by
Tarbert Llc and C O Waypoint Homes
Purchase Details
Closed on
Oct 1, 2013
Sold by
Hyden Donald D
Bought by
Srp Sub Llc
Purchase Details
Closed on
Mar 13, 2007
Sold by
Southfork Hms Inc
Bought by
Hyden Donald D
Home Financials for this Owner
Home Financials are based on the most recent Mortgage that was taken out on this home.
Original Mortgage
$102,320
Interest Rate
6.3%
Mortgage Type
New Conventional
Purchase Details
Closed on
Jul 17, 2006
Sold by
Colonial Development Inc
Bought by
Southfork Homes Inc
Purchase Details
Closed on
Jul 22, 2004
Bought by
Colonial Development Inc
Create a Home Valuation Report for This Property
The Home Valuation Report is an in-depth analysis detailing your home's value as well as a comparison with similar homes in the area
Home Values in the Area
Average Home Value in this Area
Purchase History
| Date | Buyer | Sale Price | Title Company |
|---|---|---|---|
| Sway 2014 1 Borrower Llc | -- | -- | |
| Tarbert Llc | -- | -- | |
| Srp Sub Llc | $75,000 | -- | |
| Hyden Donald D | $127,900 | -- | |
| Southfork Homes Inc | $40,000 | -- | |
| Colonial Development Inc | -- | -- |
Source: Public Records
Mortgage History
| Date | Status | Borrower | Loan Amount |
|---|---|---|---|
| Previous Owner | Hyden Donald D | $102,320 |
Source: Public Records
Tax History Compared to Growth
Tax History
| Year | Tax Paid | Tax Assessment Tax Assessment Total Assessment is a certain percentage of the fair market value that is determined by local assessors to be the total taxable value of land and additions on the property. | Land | Improvement |
|---|---|---|---|---|
| 2024 | $2,647 | $103,558 | $24,800 | $78,758 |
| 2023 | $2,573 | $100,678 | $24,800 | $75,878 |
| 2022 | $1,820 | $59,987 | $16,000 | $43,987 |
| 2021 | $1,918 | $59,987 | $16,000 | $43,987 |
| 2020 | $1,920 | $59,987 | $16,000 | $43,987 |
| 2019 | $1,838 | $56,200 | $16,000 | $40,200 |
| 2018 | $1,798 | $55,587 | $11,600 | $43,987 |
| 2017 | $1,201 | $41,259 | $11,600 | $29,659 |
| 2016 | $1,357 | $41,577 | $11,600 | $29,977 |
| 2015 | $1,372 | $41,894 | $11,600 | $30,294 |
| 2014 | $1,044 | $38,452 | $7,840 | $30,612 |
| 2013 | -- | $36,635 | $7,840 | $28,795 |
Source: Public Records
Map
Nearby Homes
- 112 Shallow Way
- 0 Perkins Rd Unit 10623675
- 0 Perkins Rd Unit 7664605
- 1190 Foster Rd
- 2439 Kumbanad Ct
- 84 Morningdale Cir
- 1 Us 53 Hwy
- 0 Wall Rd Unit 10504981
- 0 Wall Rd Unit 7564754
- 572 Elder Rd SE
- 568 Elder Rd SE
- 564 Elder Rd SE
- 576 Elder Rd SE
- The Everglade Plan at Sutton's Landing - Sutton’s Landing
- The Farmington Plan at Sutton's Landing - Sutton’s Landing
- 890 Smith Mill Rd
- 1006 Trichur Rd
- 223 Westlyn Way
- 938 Austin Rd
- 61 Westlyn Ln
- 1602 Queens Dr
- 1429 Langdon Park Cir
- 0 Langdon Park Cir Unit 7541699
- 1185 Langdon Park Cir
- 1180 Langdon Park Cir
- 1170 Langdon Park Cir
- 1155 Langdon Park Cir
- 1604 Queens Dr
- 1160 Langdon Park Cir
- 1190 Langdon Park Cir
- 0 Queens Dr Unit 7493251
- 0 Queens Dr Unit 7101181
- 0 Queens Dr Unit 7068852
- 0 Queens Dr Unit 7249568
- 0 Queens Dr Unit 3126625
- 0 Queens Dr
- 1608 Queens Dr
- 1111 Bethlehem Rd
- 1568 Langdon Park Dr
- 1570 Langdon Park Dr