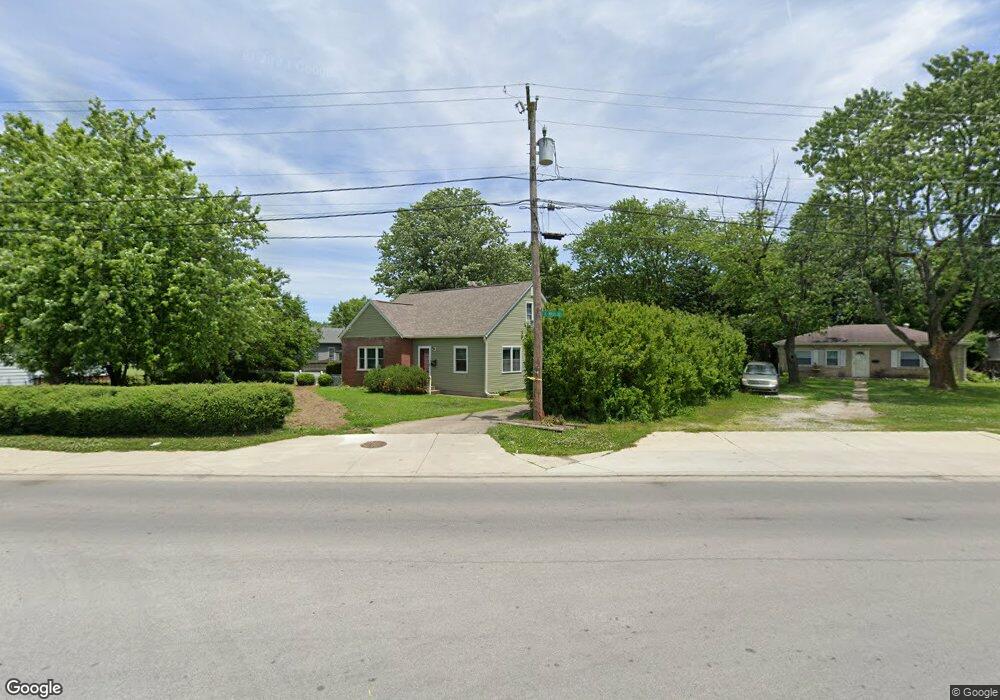
1175 N Main St Franklin, IN 46131
Estimated Value: $199,000 - $242,000
3
Beds
1
Bath
1,644
Sq Ft
$131/Sq Ft
Est. Value
About This Home
This home is located at 1175 N Main St, Franklin, IN 46131 and is currently estimated at $214,796, approximately $130 per square foot. 1175 N Main St is a home located in Johnson County with nearby schools including Northwood Elementary School, Franklin Community Middle School, and Custer Baker Intermediate School.
Ownership History
Date
Name
Owned For
Owner Type
Purchase Details
Closed on
Apr 30, 2010
Sold by
Norton Melanie J
Bought by
Catellier Erik D
Current Estimated Value
Home Financials for this Owner
Home Financials are based on the most recent Mortgage that was taken out on this home.
Original Mortgage
$87,780
Outstanding Balance
$59,409
Interest Rate
5.25%
Mortgage Type
FHA
Estimated Equity
$155,387
Create a Home Valuation Report for This Property
The Home Valuation Report is an in-depth analysis detailing your home's value as well as a comparison with similar homes in the area
Home Values in the Area
Average Home Value in this Area
Purchase History
| Date | Buyer | Sale Price | Title Company |
|---|---|---|---|
| Catellier Erik D | -- | None Available |
Source: Public Records
Mortgage History
| Date | Status | Borrower | Loan Amount |
|---|---|---|---|
| Open | Catellier Erik D | $87,780 |
Source: Public Records
Tax History Compared to Growth
Tax History
| Year | Tax Paid | Tax Assessment Tax Assessment Total Assessment is a certain percentage of the fair market value that is determined by local assessors to be the total taxable value of land and additions on the property. | Land | Improvement |
|---|---|---|---|---|
| 2025 | $1,261 | $142,800 | $35,800 | $107,000 |
| 2024 | $1,261 | $121,000 | $35,800 | $85,200 |
| 2023 | $1,269 | $121,000 | $35,800 | $85,200 |
| 2022 | $1,317 | $121,000 | $35,800 | $85,200 |
| 2021 | $1,126 | $104,400 | $32,500 | $71,900 |
| 2020 | $958 | $93,100 | $25,300 | $67,800 |
| 2019 | $938 | $93,100 | $25,300 | $67,800 |
| 2018 | $544 | $75,600 | $17,900 | $57,700 |
| 2017 | $850 | $75,000 | $17,900 | $57,100 |
| 2016 | $1,163 | $75,000 | $17,900 | $57,100 |
| 2014 | $1,154 | $115,400 | $52,200 | $63,200 |
| 2013 | $1,154 | $115,500 | $52,300 | $63,200 |
Source: Public Records
Map
Nearby Homes
- 926 Walnut St
- 56 Central Ave
- 315 Schoolhouse Rd
- 1624 Roberts Rd
- 700 Johnson Ave
- 990 Canary Creek Dr
- 356 N Main St
- 351 Cincinnati St
- 1804 Acorn Rd
- 601 Duane St
- 698 Yandes St
- 199 Walnut St
- 901 Mallory Pkwy
- 1081 Torino Ln Unit 1083
- 651 Hamilton Ave
- 253 W Madison St
- 601 Hurricane St
- 0 W 900 Hwy Unit 202537998
- 2084 Pelican Dr
- 2090 Pelican Dr