1175 Sable Ln Unit 321 Candor, NC 27229
Estimated Value: $278,000 - $433,000
1
Bed
1
Bath
578
Sq Ft
$593/Sq Ft
Est. Value
About This Home
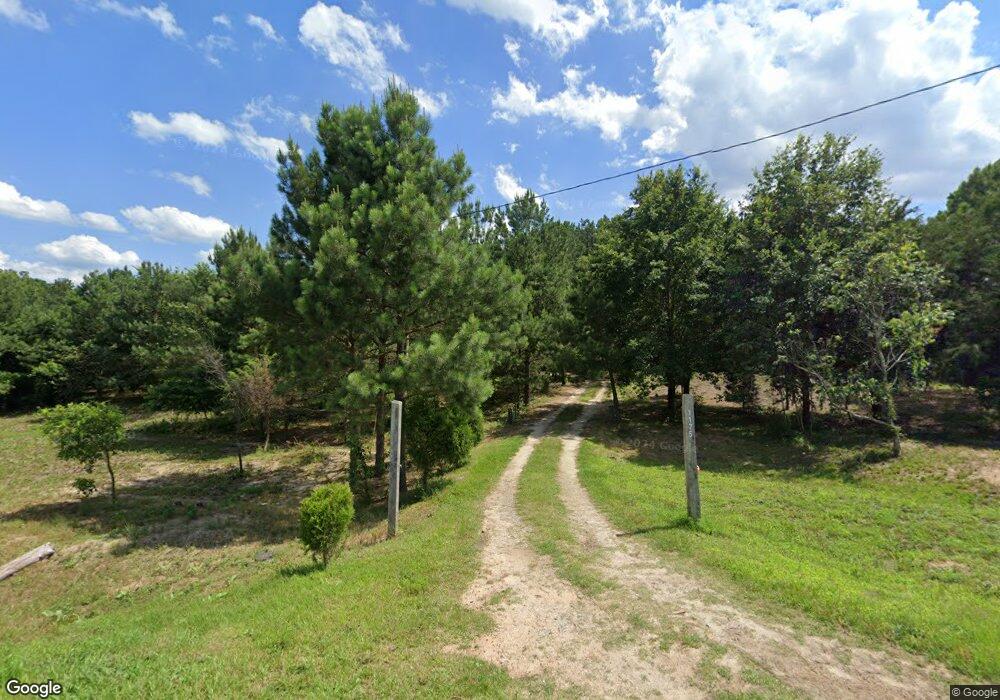
This home is located at 1175 Sable Ln Unit 321, Candor, NC 27229 and is currently estimated at $342,807, approximately $593 per square foot. 1175 Sable Ln Unit 321 is a home located in Montgomery County with nearby schools including Candor Elementary School, Mount Gilead Elementary School, and East Middle School.
Ownership History
Date
Name
Owned For
Owner Type
Purchase Details
Closed on
Nov 17, 2022
Sold by
Balard-Doby Inc
Bought by
Gibson Robert
Current Estimated Value
Home Financials for this Owner
Home Financials are based on the most recent Mortgage that was taken out on this home.
Original Mortgage
$59,900
Outstanding Balance
$52,411
Interest Rate
6.23%
Mortgage Type
New Conventional
Estimated Equity
$290,396
Purchase Details
Closed on
Jul 11, 2019
Sold by
Cook Kevin and Cook Christa
Bought by
Ballard Doby Inc
Purchase Details
Closed on
Sep 17, 2015
Sold by
Abbott Deyous C and Abbott Jean A
Bought by
Cook Kevin and Cook Christa
Purchase Details
Closed on
Jul 29, 2015
Sold by
Deyuos C Abbott Jr Trust
Bought by
Abbott Deyous C
Purchase Details
Closed on
Jun 7, 2010
Sold by
Sneed William B and Sneed Rachel Carol
Bought by
Deyuos C Abbott Jr Trust
Create a Home Valuation Report for This Property
The Home Valuation Report is an in-depth analysis detailing your home's value as well as a comparison with similar homes in the area
Purchase History
| Date | Buyer | Sale Price | Title Company |
|---|---|---|---|
| Gibson Robert | $300,000 | -- | |
| Gibson Robert | $300,000 | None Listed On Document | |
| Ballard Doby Inc | $137,500 | None Available | |
| Cook Kevin | $115,000 | None Available | |
| Abbott Deyous C | -- | None Available | |
| Deyuos C Abbott Jr Trust | $31,000 | -- |
Source: Public Records
Mortgage History
| Date | Status | Borrower | Loan Amount |
|---|---|---|---|
| Open | Gibson Robert | $59,900 | |
| Closed | Gibson Robert | $59,900 | |
| Closed | Ballard Doby Inc | $0 |
Source: Public Records
Tax History
| Year | Tax Paid | Tax Assessment Tax Assessment Total Assessment is a certain percentage of the fair market value that is determined by local assessors to be the total taxable value of land and additions on the property. | Land | Improvement |
|---|---|---|---|---|
| 2025 | $834 | $135,687 | $34,000 | $101,687 |
| 2024 | $8 | $135,687 | $34,000 | $101,687 |
| 2023 | $834 | $135,687 | $34,000 | $101,687 |
| 2022 | $834 | $135,687 | $34,000 | $101,687 |
| 2021 | $834 | $135,687 | $34,000 | $101,687 |
| 2020 | $834 | $135,687 | $34,000 | $101,687 |
| 2018 | $516 | $83,200 | $34,000 | $49,200 |
| 2017 | $516 | $83,200 | $34,000 | $49,200 |
| 2016 | $516 | $83,200 | $34,000 | $49,200 |
| 2015 | -- | $83,200 | $0 | $0 |
| 2014 | -- | $83,222 | $0 | $0 |
Source: Public Records
Map
Nearby Homes
- 132 W Moore St
- 138 W Moore St
- 164 Haines Rd
- 0 Leak Rd Unit 730300
- 0 Leake Rd Unit CAR4307775
- 00 Pemberton Dr
- 0 Pemberton Dr
- 0 Dry Creek Rd
- 0 Bowden Dr Unit CAR4333835
- 300 Mccall Rd
- 654 Clayton Carriker Rd
- 3103 N Carolina 731
- 138 Capel Mill Rd
- 151 Godfrey Rd
- 1035 Mill Rd
- 1890 Flowers Rd
- 0 Center Baptist Church Rd Unit 100539643
- 1711 Currie Mill Rd
- 0 Flowers Unit 100531471
- 2627 Mccallum Rd
- 1175 Sable Ln
- 173 Sneed Dr
- 5599 Us 220 Alternate S
- 5585 Us 220 Alt S
- 1155 Sable Ln
- 120 Adams Cir
- 225 Morgan Rd
- 274 Adams Cir
- 108 Amandas Way
- 151 Adams Cir
- 0 Amandas Way Dr
- 5751 Us 220 Alt S
- 116 Amandas Way
- 136 Amandas Way
- 169 Adams Cir
- 150 Amandas Way
- 165 Amandas Way
- 0 Us 220 Alternate S
- 206 Mcleod Dr
- 105 Sand Dr
Your Personal Tour Guide
Ask me questions while you tour the home.