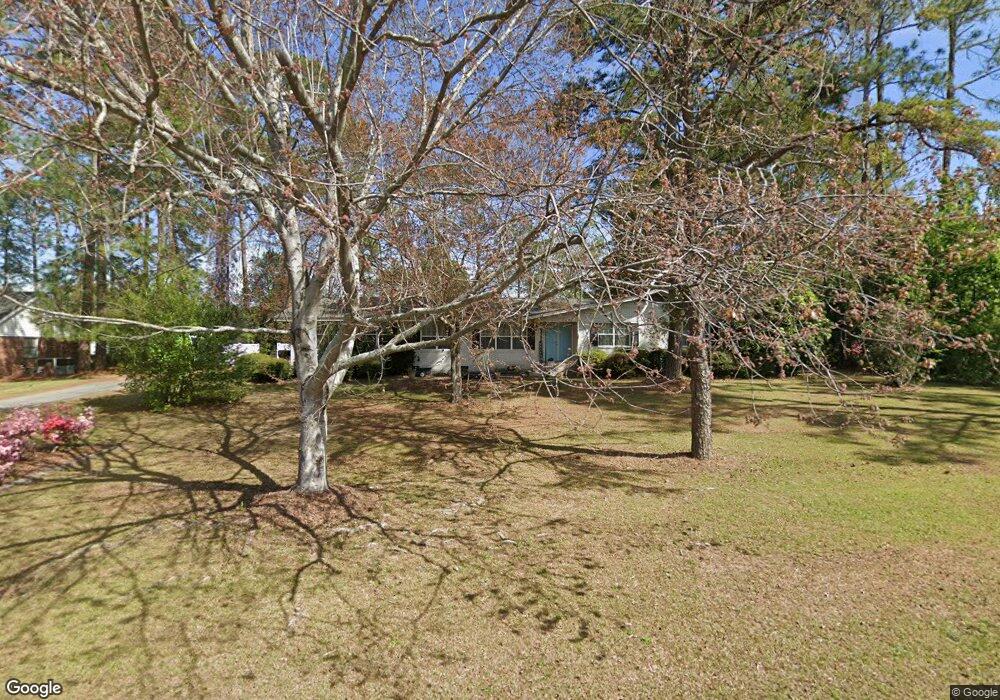
1175 W Roanoke Drive Extension Fitzgerald, GA 31750
Estimated Value: $176,000 - $233,000
3
Beds
2
Baths
1,646
Sq Ft
$122/Sq Ft
Est. Value
About This Home
This home is located at 1175 W Roanoke Drive Extension, Fitzgerald, GA 31750 and is currently estimated at $200,143, approximately $121 per square foot. 1175 W Roanoke Drive Extension is a home located in Ben Hill County with nearby schools including Ben Hill County Primary School, Ben Hill Elementary School, and Ben Hill County Middle School.
Ownership History
Date
Name
Owned For
Owner Type
Purchase Details
Closed on
Sep 30, 2014
Sold by
Brown Chadwick J
Bought by
Hester Jonathan David
Current Estimated Value
Home Financials for this Owner
Home Financials are based on the most recent Mortgage that was taken out on this home.
Original Mortgage
$78,000
Outstanding Balance
$59,952
Interest Rate
4.17%
Mortgage Type
New Conventional
Estimated Equity
$140,191
Purchase Details
Closed on
May 16, 2011
Sold by
Faircloth Kay C
Bought by
Brown Chadwick J
Home Financials for this Owner
Home Financials are based on the most recent Mortgage that was taken out on this home.
Original Mortgage
$88,240
Interest Rate
4.88%
Mortgage Type
Future Advance Clause Open End Mortgage
Purchase Details
Closed on
May 17, 1991
Bought by
Faircloth Kay
Create a Home Valuation Report for This Property
The Home Valuation Report is an in-depth analysis detailing your home's value as well as a comparison with similar homes in the area
Home Values in the Area
Average Home Value in this Area
Purchase History
| Date | Buyer | Sale Price | Title Company |
|---|---|---|---|
| Hester Jonathan David | $97,500 | -- | |
| Brown Chadwick J | $103,500 | -- | |
| Faircloth Kay | $73,000 | -- |
Source: Public Records
Mortgage History
| Date | Status | Borrower | Loan Amount |
|---|---|---|---|
| Open | Hester Jonathan David | $78,000 | |
| Previous Owner | Brown Chadwick J | $88,240 |
Source: Public Records
Tax History Compared to Growth
Tax History
| Year | Tax Paid | Tax Assessment Tax Assessment Total Assessment is a certain percentage of the fair market value that is determined by local assessors to be the total taxable value of land and additions on the property. | Land | Improvement |
|---|---|---|---|---|
| 2024 | $1,479 | $54,237 | $6,000 | $48,237 |
| 2023 | $786 | $49,640 | $6,000 | $43,640 |
| 2022 | $1,231 | $43,231 | $6,000 | $37,231 |
| 2021 | $1,176 | $40,235 | $6,000 | $34,235 |
| 2020 | $1,177 | $39,876 | $6,000 | $33,876 |
| 2019 | $1,173 | $39,876 | $6,000 | $33,876 |
| 2018 | $1,310 | $39,598 | $6,000 | $33,598 |
| 2017 | $1,159 | $39,319 | $6,000 | $33,319 |
| 2016 | $1,104 | $39,220 | $6,000 | $33,220 |
| 2015 | -- | $39,557 | $6,000 | $33,557 |
| 2014 | -- | $41,912 | $6,000 | $35,912 |
Source: Public Records
Map
Nearby Homes
- 1171 W Roanoke Dr Ext None
- 160 Lakeview Dr
- 152 David Dr
- 117 Meadowlark Ln
- 0 Irwinville Hwy
- 225 Meadowlark Ln
- 138 Azalea Ln
- 277 Lincoln Ave
- 178 Burnside Rd
- 0 Clay Rd
- 271 Lincoln Ave
- 249 Lincoln Ave
- 697 Benjamin H Hill Dr
- 650 Benjamin H Hill Dr
- 650 Benjamin H Hill Dr W
- 0 Lincoln Ave
- 0 Benjamin H Hill Dr Unit 21545626
- 141 Wenona Way
- 204 Irwinville Hwy
- 200 Irwinville Hwy
- 26 Newcomer Trail
- 32 Newcomer Trail
- 30 Newcomer Trail
- 28 Newcomer Trail
- 24 Newcomer Trail
- 22 Newcomer Trail
- 1181 W Roanoke Drive Extension
- 128 Shady Ln
- 1171 W Roanoke Drive Extension
- 124 Shady Ln
- 134 Shady Ln
- 102 Newcomer Trail
- 1180 W Roanoke Drive Extension
- 1187 W Roanoke Drive Extension
- 1165 W Roanoke Drive Extension
- 1165 W Roanoke Dr
- 118 Shady Ln
- 140 Shady Ln
- 133 Shady Ln
- 123 Shady Ln