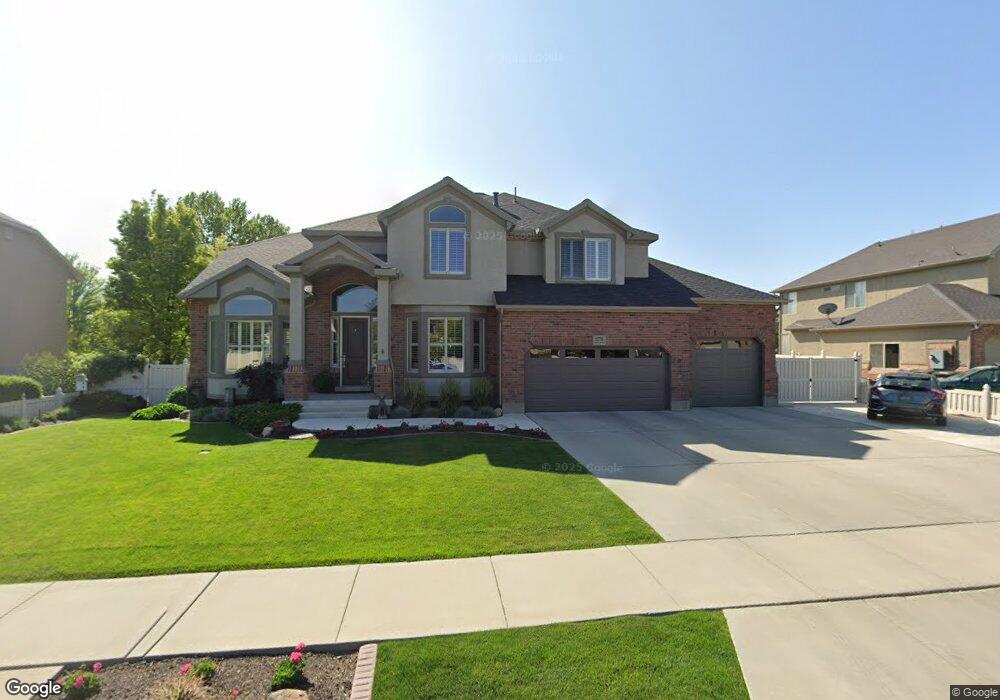
11751 Chalk Creek Way South Jordan, UT 84095
Estimated Value: $1,006,000 - $1,133,000
5
Beds
3
Baths
5,212
Sq Ft
$202/Sq Ft
Est. Value
About This Home
This home is located at 11751 Chalk Creek Way, South Jordan, UT 84095 and is currently estimated at $1,052,860, approximately $202 per square foot. 11751 Chalk Creek Way is a home located in Salt Lake County with nearby schools including Monte Vista Elementary School, South Jordan Middle School, and Mountain West Montessori Academy.
Ownership History
Date
Name
Owned For
Owner Type
Purchase Details
Closed on
Jan 31, 2005
Sold by
Lloyd Ray E and Lloyd Joan N
Bought by
Clarke Drew J and Clarke Adrienne
Current Estimated Value
Home Financials for this Owner
Home Financials are based on the most recent Mortgage that was taken out on this home.
Original Mortgage
$263,500
Outstanding Balance
$133,228
Interest Rate
5.67%
Mortgage Type
Unknown
Estimated Equity
$919,632
Purchase Details
Closed on
Jun 27, 2002
Sold by
Perry Homes Inc
Bought by
Lloyd Ray E and Lloyd Joan N
Home Financials for this Owner
Home Financials are based on the most recent Mortgage that was taken out on this home.
Original Mortgage
$191,100
Interest Rate
6.86%
Create a Home Valuation Report for This Property
The Home Valuation Report is an in-depth analysis detailing your home's value as well as a comparison with similar homes in the area
Home Values in the Area
Average Home Value in this Area
Purchase History
| Date | Buyer | Sale Price | Title Company |
|---|---|---|---|
| Clarke Drew J | -- | First American Title | |
| Lloyd Ray E | -- | Meridian Title | |
| Perry Homes Inc | -- | Meridian Title |
Source: Public Records
Mortgage History
| Date | Status | Borrower | Loan Amount |
|---|---|---|---|
| Open | Clarke Drew J | $263,500 | |
| Previous Owner | Lloyd Ray E | $191,100 |
Source: Public Records
Tax History Compared to Growth
Tax History
| Year | Tax Paid | Tax Assessment Tax Assessment Total Assessment is a certain percentage of the fair market value that is determined by local assessors to be the total taxable value of land and additions on the property. | Land | Improvement |
|---|---|---|---|---|
| 2025 | $4,784 | $989,600 | $263,100 | $726,500 |
| 2024 | $4,784 | $908,400 | $250,600 | $657,800 |
| 2023 | $4,752 | $851,300 | $243,300 | $608,000 |
| 2022 | $4,876 | $856,200 | $238,500 | $617,700 |
| 2021 | $3,916 | $630,800 | $197,200 | $433,600 |
| 2020 | $3,865 | $583,600 | $197,200 | $386,400 |
| 2019 | $3,874 | $575,000 | $186,600 | $388,400 |
| 2018 | $3,691 | $545,200 | $185,500 | $359,700 |
| 2017 | $3,619 | $523,900 | $182,300 | $341,600 |
| 2016 | $3,873 | $531,200 | $168,500 | $362,700 |
| 2015 | $3,626 | $483,600 | $170,100 | $313,500 |
| 2014 | $3,347 | $438,700 | $162,200 | $276,500 |
Source: Public Records
Map
Nearby Homes
- 11716 S 2610 W
- 2626 W Midas Side Way
- 2732 W Lizzi Cove
- 2602 W 11625 S
- 3168 Chalk Creek Way
- 2817 W 11460 St S Unit 203
- 11513 S Jackson Downs Way
- 2853 W 12075 S
- 11788 S Myers Park Ln Unit 101
- 11707 S Myers Park Ln Unit 111
- 2295 W Myers Ln
- 3371 W Waterbridge Cove Unit 417
- 3376 W Water Crescent Place
- 3028 W Wilkins Peak Ct
- 2410 W 11400 S
- 3312 W Country Bluff Rd
- 3407 W Pazos Cir Unit 4
- 11666 S Gold Dust Dr
- 3537 W Sojo Dr
- 3644 W Harvest Gold Way
- 11763 Chalk Creek Way
- 11763 S Chalk Creek Way
- 11739 Chalk Creek Way
- 2873 W Rock Creek Dr
- 2873 Rock Creek Dr
- 11723 Chalk Creek Way
- 2869 W 11770 S
- 11758 S Chalk Creek Way
- 2886 W 11770 S
- 11732 S Current Creek Cir
- 11732 Current Creek Cir
- 11768 Chalk Creek Way
- 11728 Chalk Creek Way
- 2883 W 11770 Way S
- 2883 W 11770 S
- 11711 Chalk Creek Way
- 11738 S Current Creek Cir
- 11716 Chalk Creek Way
- 11738 Current Creek Cir
- 11716 S Chalk Creek Way