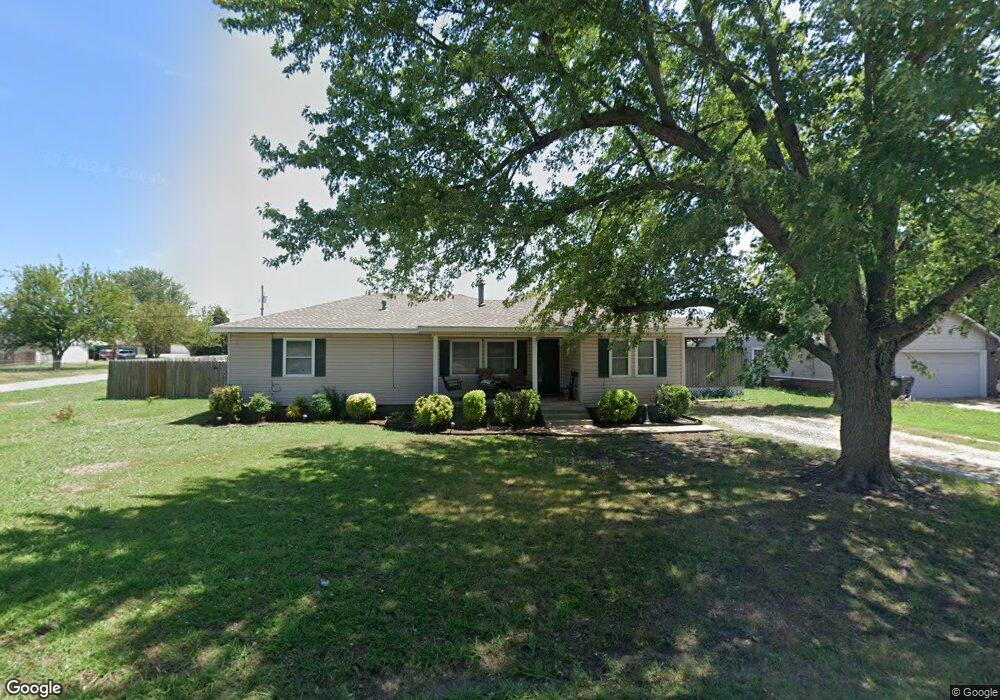
11751 N 193rd East Ave Collinsville, OK 74021
Estimated Value: $229,104 - $268,000
3
Beds
2
Baths
1,683
Sq Ft
$147/Sq Ft
Est. Value
About This Home
This home is located at 11751 N 193rd East Ave, Collinsville, OK 74021 and is currently estimated at $246,776, approximately $146 per square foot. 11751 N 193rd East Ave is a home located in Rogers County with nearby schools including Northeast Elementary School, Owasso 6th Grade Center, and Owasso 8th Grade Center.
Ownership History
Date
Name
Owned For
Owner Type
Purchase Details
Closed on
Dec 19, 2008
Sold by
Owen Kellie Lee and Croswhite Kellie Lee
Bought by
Suto Michael P
Current Estimated Value
Home Financials for this Owner
Home Financials are based on the most recent Mortgage that was taken out on this home.
Original Mortgage
$132,653
Outstanding Balance
$87,077
Interest Rate
6.08%
Mortgage Type
New Conventional
Estimated Equity
$159,699
Purchase Details
Closed on
Mar 28, 2008
Sold by
Smalley Douglas W and Smalley Delana Sue
Bought by
Croswhite Kellie Lee
Home Financials for this Owner
Home Financials are based on the most recent Mortgage that was taken out on this home.
Original Mortgage
$60,000
Interest Rate
6.11%
Mortgage Type
New Conventional
Create a Home Valuation Report for This Property
The Home Valuation Report is an in-depth analysis detailing your home's value as well as a comparison with similar homes in the area
Home Values in the Area
Average Home Value in this Area
Purchase History
| Date | Buyer | Sale Price | Title Company |
|---|---|---|---|
| Suto Michael P | $130,000 | Beacan Title Company | |
| Croswhite Kellie Lee | $110,000 | Firstitle & Abstract Service |
Source: Public Records
Mortgage History
| Date | Status | Borrower | Loan Amount |
|---|---|---|---|
| Open | Suto Michael P | $132,653 | |
| Previous Owner | Croswhite Kellie Lee | $60,000 |
Source: Public Records
Tax History Compared to Growth
Tax History
| Year | Tax Paid | Tax Assessment Tax Assessment Total Assessment is a certain percentage of the fair market value that is determined by local assessors to be the total taxable value of land and additions on the property. | Land | Improvement |
|---|---|---|---|---|
| 2025 | $1,698 | $16,543 | $3,487 | $13,056 |
| 2024 | $1,694 | $16,218 | $3,347 | $12,871 |
| 2023 | $1,694 | $15,746 | $2,200 | $13,546 |
| 2022 | $1,618 | $15,287 | $2,200 | $13,087 |
| 2021 | $1,551 | $14,842 | $2,200 | $12,642 |
| 2020 | $1,512 | $14,620 | $2,200 | $12,420 |
| 2019 | $1,467 | $14,091 | $2,200 | $11,891 |
| 2018 | $1,404 | $13,944 | $1,650 | $12,294 |
| 2017 | $1,405 | $13,831 | $1,650 | $12,181 |
| 2016 | $1,368 | $13,484 | $1,650 | $11,834 |
| 2015 | $1,384 | $13,579 | $2,200 | $11,379 |
| 2014 | $1,354 | $13,183 | $2,200 | $10,983 |
Source: Public Records
Map
Nearby Homes
- 12047 N 193rd East Ave
- 11610 N 190th East Ave
- 12225 N 194th East Ave
- 19914 E 126th St N
- 4608 E 472 Rd
- 11381 N 209th E
- 4728 E Hwy 20
- 12192 N 179th East Ave
- 12875 N 193rd East Ave
- 0 Hobbs Creek Dr Unit 2541616
- 20624 S Brentwood Ave
- 13247 Hobbs Creek Dr
- 17542 E 112th St N
- 20823 S Concord Ave
- 20603 S Concord Ave
- 0 E 106th St N Unit 2543814
- 0 E 106th St N Unit 2546711
- 5163 E Hickory Hollow Dr
- 5135 E Hickory Bluff Dr
- 5132 E Madison St
- 11749 N 193rd East Ave
- 11801 N 193rd East Ave
- 11752 N 194th East Ave
- 11747 N 193rd East Ave
- 11748 N 194th East Ave
- 11758 N 193rd East Ave
- 11750 N 193rd East Ave
- 11802 N 193rd East Ave
- 11746 N 193rd East Ave
- 11804 N 194th East Ave
- 11800 N 193rd Ave E
- 11738 N 194th East Ave
- 11725 N 194th East Ave
- 11807 N 193rd East Ave
- 11736 N 193rd East Ave
- 11743 N 194th Ave E
- 19224 E 118th St N
- 19209 E 118th St N
- 11801 N 194th Ave E
- 11801 N 194th East Ave