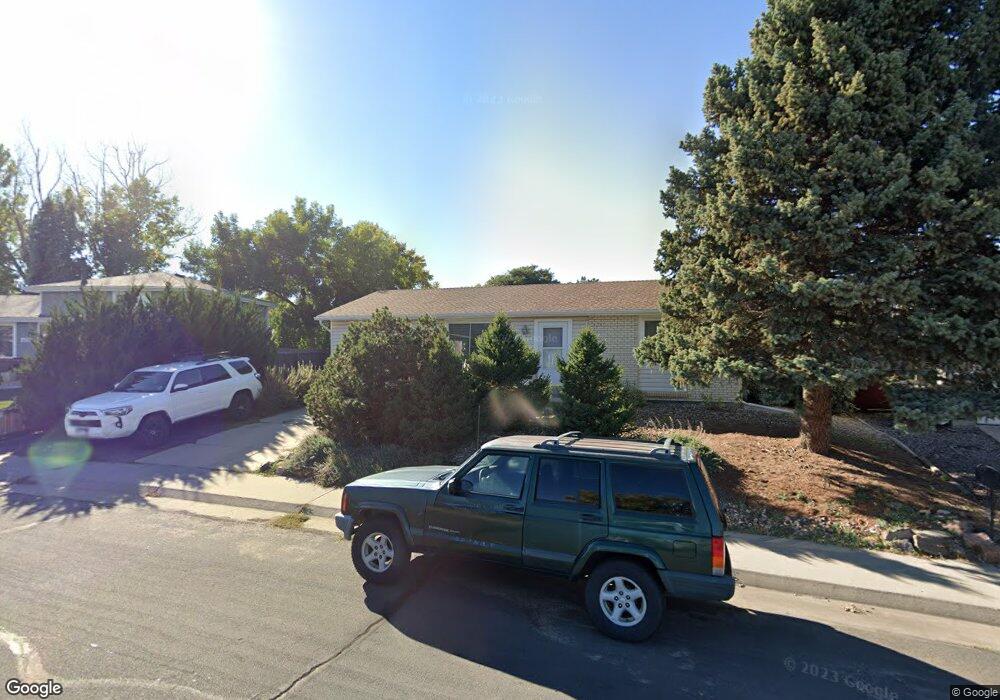
11753 Steele St Thornton, CO 80233
Woodglen NeighborhoodEstimated Value: $400,777 - $465,000
3
Beds
2
Baths
1,700
Sq Ft
$258/Sq Ft
Est. Value
About This Home
This home is located at 11753 Steele St, Thornton, CO 80233 and is currently estimated at $437,944, approximately $257 per square foot. 11753 Steele St is a home located in Adams County with nearby schools including Woodglen Elementary School, Century Middle School, and Mountain Range High School.
Ownership History
Date
Name
Owned For
Owner Type
Purchase Details
Closed on
Jun 6, 2012
Sold by
Community Resources & Housing Developmen
Bought by
Levsen Erik and Khalsa Gurujit
Current Estimated Value
Home Financials for this Owner
Home Financials are based on the most recent Mortgage that was taken out on this home.
Original Mortgage
$148,500
Outstanding Balance
$103,253
Interest Rate
3.9%
Mortgage Type
New Conventional
Estimated Equity
$334,691
Purchase Details
Closed on
Nov 23, 2011
Sold by
Secretary Of Housing & Urban Development
Bought by
Community Resources & Housing Developme3
Purchase Details
Closed on
Jun 15, 2011
Sold by
Salas Colleen J and Salas Kenneth C
Bought by
Branch Banking & Trust Company
Purchase Details
Closed on
Jun 30, 1994
Sold by
Maki Clifford E
Bought by
Salas Kenneth C and Salas Colleen J
Home Financials for this Owner
Home Financials are based on the most recent Mortgage that was taken out on this home.
Original Mortgage
$82,055
Interest Rate
8.52%
Mortgage Type
FHA
Purchase Details
Closed on
Sep 23, 1992
Create a Home Valuation Report for This Property
The Home Valuation Report is an in-depth analysis detailing your home's value as well as a comparison with similar homes in the area
Home Values in the Area
Average Home Value in this Area
Purchase History
| Date | Buyer | Sale Price | Title Company |
|---|---|---|---|
| Levsen Erik | $170,000 | Ats | |
| Community Resources & Housing Developme3 | $100,000 | None Available | |
| Branch Banking & Trust Company | -- | None Available | |
| Salas Kenneth C | $82,500 | -- | |
| -- | $61,100 | -- |
Source: Public Records
Mortgage History
| Date | Status | Borrower | Loan Amount |
|---|---|---|---|
| Open | Levsen Erik | $148,500 | |
| Previous Owner | Salas Kenneth C | $82,055 |
Source: Public Records
Tax History Compared to Growth
Tax History
| Year | Tax Paid | Tax Assessment Tax Assessment Total Assessment is a certain percentage of the fair market value that is determined by local assessors to be the total taxable value of land and additions on the property. | Land | Improvement |
|---|---|---|---|---|
| 2024 | $2,591 | $25,440 | $6,060 | $19,380 |
| 2023 | $2,565 | $28,750 | $6,090 | $22,660 |
| 2022 | $2,482 | $21,810 | $6,050 | $15,760 |
| 2021 | $2,482 | $21,810 | $6,050 | $15,760 |
| 2020 | $2,422 | $21,710 | $6,220 | $15,490 |
| 2019 | $2,427 | $21,710 | $6,220 | $15,490 |
| 2018 | $2,032 | $17,660 | $5,760 | $11,900 |
| 2017 | $1,848 | $17,660 | $5,760 | $11,900 |
| 2016 | $1,367 | $12,720 | $3,180 | $9,540 |
| 2015 | $1,365 | $12,720 | $3,180 | $9,540 |
| 2014 | -- | $10,970 | $2,710 | $8,260 |
Source: Public Records
Map
Nearby Homes
- 11776 Saint Paul St
- 2656 E 117th Way
- 11817 Cook St
- 11879 Madison Place
- 3491 E 119th St
- 11928 Monroe St
- 11845 Garfield St
- 11546 Monroe Way
- 11848 Jackson Cir
- 3880 E 117th Ave
- 11506 Adams St
- 11630 Columbine St
- 11901 Bellaire St Unit D
- 12131 Elizabeth Ct
- 11922 Bellaire St Unit F
- 4135 E 119th Place Unit B
- 11961 Bellaire St Unit A
- 4165 E 119th Place Unit A
- 11981 Bellaire St Unit D
- 11861 Claude Way
- 11763 Steele St
- 11743 Steele St
- 11770 Saint Paul St
- 11766 Saint Paul St
- 11733 Steele St
- 11773 Steele St
- 11760 Saint Paul St
- 11764 Steele St
- 11780 Saint Paul St
- 11744 Steele St
- 3176 E 117th Place
- 3156 E 117th Place
- 11734 Steele St
- 11723 Steele St
- 11756 Saint Paul St
- 3376 E 117th Place
- 11786 Saint Paul St
- 2837 E 117th Way
- 2882 E 117th Ct
- 11724 Steele St