
Seller's Agent in 2012
John Bowman
Highland Trace Realty, Inc.
(304) 874-3030
77 Total Sales
Estimated Value: $150,059 - $282,000
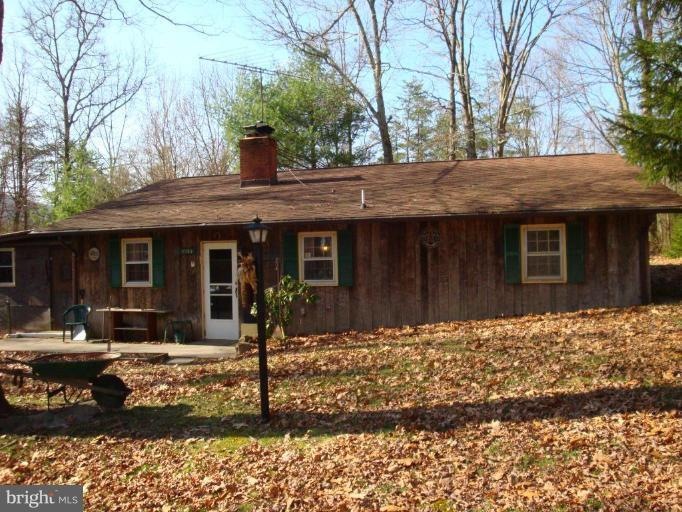
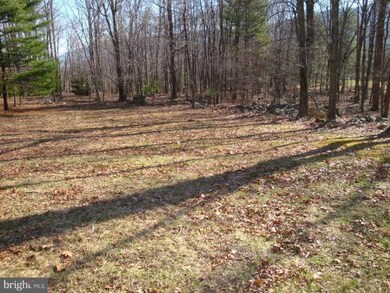
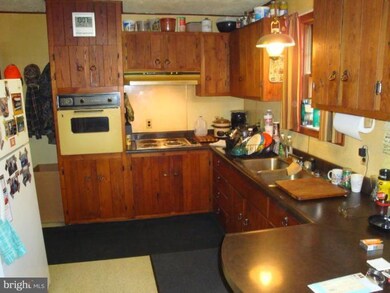
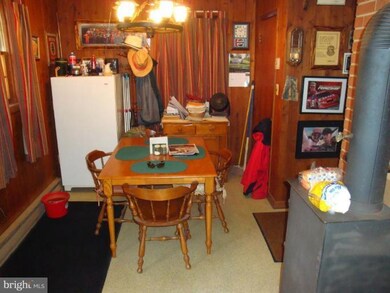
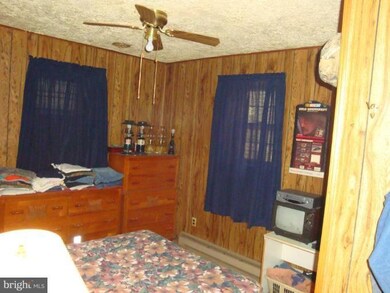
Charming cabin on 2 1/2 acres adjoining the George Washington National Forest. Enjoy the beautiful country that surrounds this great location.
Last Agent to Sell the Property
Highland Trace Realty, Inc. License #WV0014391 Listed on: 03/29/2010
| Date | Event | Price | Change | Sq Ft Price |
|---|---|---|---|---|
| 02/06/2012 02/06/12 | Sold | $55,000 | -20.3% | $47 / Sq Ft |
| 12/20/2011 12/20/11 | Pending | -- | -- | -- |
| 11/08/2011 11/08/11 | Price Changed | $69,000 | -12.7% | $59 / Sq Ft |
| 08/02/2011 08/02/11 | Price Changed | $79,000 | -11.2% | $68 / Sq Ft |
| 06/06/2011 06/06/11 | Price Changed | $89,000 | -10.1% | $76 / Sq Ft |
| 05/05/2011 05/05/11 | Price Changed | $99,000 | -9.2% | $85 / Sq Ft |
| 03/30/2011 03/30/11 | Price Changed | $109,000 | -0.9% | $94 / Sq Ft |
| 03/30/2011 03/30/11 | Price Changed | $109,950 | -8.3% | $94 / Sq Ft |
| 01/04/2011 01/04/11 | Price Changed | $119,950 | -7.7% | $103 / Sq Ft |
| 10/07/2010 10/07/10 | Price Changed | $129,950 | -7.1% | $112 / Sq Ft |
| 08/26/2010 08/26/10 | Price Changed | $139,950 | -12.5% | $120 / Sq Ft |
| 05/28/2010 05/28/10 | Price Changed | $159,900 | -15.8% | $137 / Sq Ft |
| 03/29/2010 03/29/10 | For Sale | $189,900 | -- | $163 / Sq Ft |
| Year | Tax Paid | Tax Assessment Tax Assessment Total Assessment is a certain percentage of the fair market value that is determined by local assessors to be the total taxable value of land and additions on the property. | Land | Improvement |
|---|---|---|---|---|
| 2024 | $351 | $45,540 | $19,080 | $26,460 |
| 2023 | $352 | $45,540 | $19,080 | $26,460 |
| 2022 | $349 | $44,820 | $19,080 | $25,740 |
| 2021 | $338 | $43,320 | $19,080 | $24,240 |
| 2020 | $330 | $42,600 | $19,080 | $23,520 |
| 2019 | $333 | $42,600 | $19,080 | $23,520 |
| 2018 | $332 | $42,600 | $19,080 | $23,520 |
| 2017 | $333 | $42,660 | $19,080 | $23,580 |
| 2016 | $349 | $44,460 | $19,080 | $25,380 |
| 2015 | $349 | $44,460 | $19,080 | $25,380 |
| 2014 | $349 | $44,460 | $19,080 | $25,380 |
Seller's Agent in 2012
John Bowman
Highland Trace Realty, Inc.
(304) 874-3030
77 Total Sales
Source: Bright MLS
MLS Number: 1004782948
APN: 01-411-00130011
Disclaimer: Certain information contained herein is derived from information provided by parties other than Homes.com. All information provided is deemed reliable, but is not guaranteed to be accurate and should be independently verified.
![]() The data relating to real estate for sale on this website appears in part through the BRIGHT Internet Data Exchange program, a voluntary cooperative exchange of property listing data between licensed real estate brokerage firms, and is provided by BRIGHT through a licensing agreement.
The data relating to real estate for sale on this website appears in part through the BRIGHT Internet Data Exchange program, a voluntary cooperative exchange of property listing data between licensed real estate brokerage firms, and is provided by BRIGHT through a licensing agreement.
Listing information is from various brokers who participate in the Bright MLS IDX program and not all listings may be visible on the site.
The property information being provided on or through the website is for the personal, non-commercial use of consumers and such information may not be used for any purpose other than to identify prospective properties consumers may be interested in purchasing.
Some properties which appear for sale on the website may no longer be available because they are for instance, under contract, sold or are no longer being offered for sale.
Property information displayed is deemed reliable but is not guaranteed.
Copyright 2025 Bright MLS, Inc.