11755 N 505 Rd Tahlequah, OK 74464
Estimated Value: $199,000 - $354,000
3
Beds
2
Baths
1,540
Sq Ft
$184/Sq Ft
Est. Value
About This Home
This home is located at 11755 N 505 Rd, Tahlequah, OK 74464 and is currently estimated at $283,308, approximately $183 per square foot. 11755 N 505 Rd is a home located in Cherokee County with nearby schools including Grand View Public School.
Ownership History
Date
Name
Owned For
Owner Type
Purchase Details
Closed on
Jun 21, 2024
Sold by
Rayburn Tommy Glenn and Tommy And Jamie Rayburn Trust
Bought by
Rayburn Tommy Glenn and Rayburn Jamie Marie
Current Estimated Value
Purchase Details
Closed on
May 9, 2018
Sold by
Rayburn Tommy Glenn and Rayburn Jamie Marie
Bought by
Rayburn Tommy Glenn and Rayburn Jamie Marie
Purchase Details
Closed on
Sep 22, 2004
Sold by
Erica and Maria Flores
Bought by
Tommy and Jamie Rayburn
Purchase Details
Closed on
Sep 7, 2004
Sold by
Shannon and Joe Fields
Bought by
Tommy and Jamie Rayburn
Purchase Details
Closed on
Sep 3, 2004
Sold by
Erica Flores
Bought by
Erica and Maria Flores
Purchase Details
Closed on
Apr 16, 2002
Sold by
Dennis Stratton
Bought by
Tommy and Jamie Rayburn
Purchase Details
Closed on
Jul 17, 1998
Sold by
Clarence and Mary Cordell
Bought by
Dennis and Shannon Stratton
Create a Home Valuation Report for This Property
The Home Valuation Report is an in-depth analysis detailing your home's value as well as a comparison with similar homes in the area
Home Values in the Area
Average Home Value in this Area
Purchase History
| Date | Buyer | Sale Price | Title Company |
|---|---|---|---|
| Rayburn Tommy Glenn | -- | None Listed On Document | |
| Rayburn Tommy Glenn | -- | None Available | |
| Tommy | -- | -- | |
| Tommy | -- | -- | |
| Erica | -- | -- | |
| Tommy | $20,500 | -- | |
| Dennis | $10,000 | -- |
Source: Public Records
Tax History Compared to Growth
Tax History
| Year | Tax Paid | Tax Assessment Tax Assessment Total Assessment is a certain percentage of the fair market value that is determined by local assessors to be the total taxable value of land and additions on the property. | Land | Improvement |
|---|---|---|---|---|
| 2025 | $1,717 | $20,407 | $902 | $19,505 |
| 2024 | $1,717 | $21,676 | $3,119 | $18,557 |
| 2023 | $1,717 | $21,045 | $2,666 | $18,379 |
| 2022 | $1,379 | $20,431 | $2,189 | $18,242 |
| 2021 | $1,337 | $19,836 | $2,125 | $17,711 |
| 2020 | $1,296 | $19,258 | $2,063 | $17,195 |
| 2019 | $1,372 | $18,698 | $2,003 | $16,695 |
| 2018 | $1,339 | $18,153 | $1,945 | $16,208 |
| 2017 | $1,305 | $17,624 | $2,649 | $14,975 |
| 2016 | $1,274 | $17,111 | $2,658 | $14,453 |
| 2015 | $1,295 | $16,613 | $1,100 | $15,513 |
| 2014 | $1,295 | $16,430 | $1,100 | $15,330 |
Source: Public Records
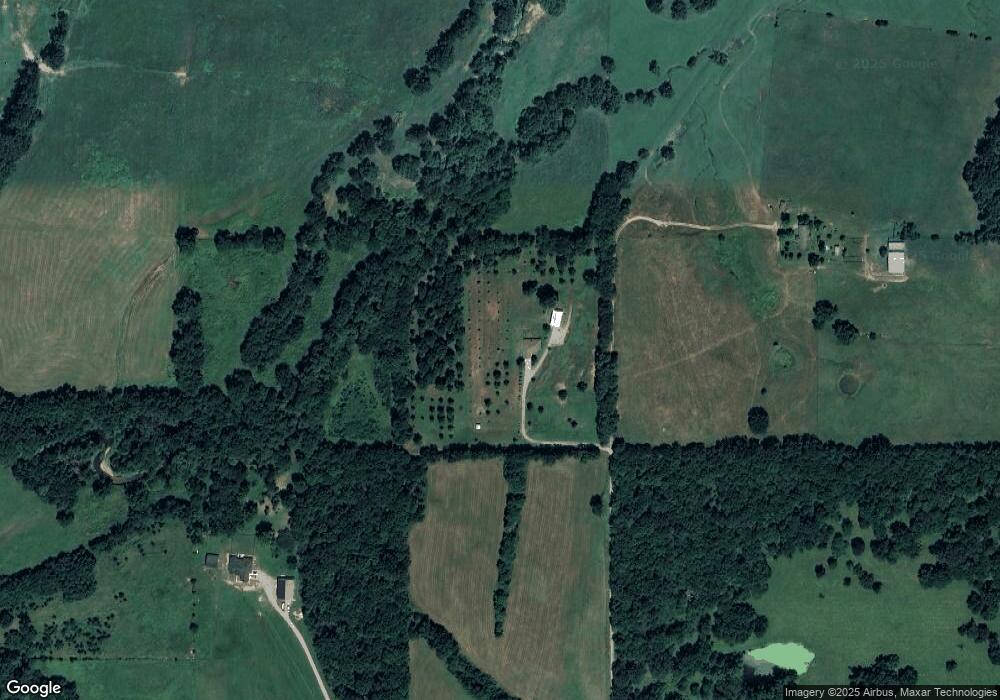
Map
Nearby Homes
- 11077 N Elm Grove Rd
- 17844 E 688 Rd
- 11457 N 510 Rd
- 17099 E Clover Cir
- 13552 State Highway 82
- 18079 E 680 Rd
- 12562 N Webster Rd
- 17564 W Grandview Dr
- 212 W Calista Dr
- 0 W Jones Rd
- 17540 W Tray
- 0 N Hwy 82 Hwy Unit 2518924
- 11388 Hwy 82
- 20819 E Steely Hollow Rd
- TBD Blk 1 Lot 11 E Steely Hollow Rd
- TBD Blk 1 Lot 4 E Steely Hollow Rd
- TBD BLK 1 Lot 10 E Steely Hollow Rd
- TBD BLK 1 Lot 9 E Steely Hollow Rd
- TBD Blk 1 Lot 1 E Steely Hollow Rd
- TBD BLK 1 Lot 2 E Steely Hollow Rd
- 17214 E Red Fuller Rd
- 11964 N 505 Rd
- 17441 E Red Fuller Rd
- 17494 E Red Fuller Rd
- 0 Red Fuller Rd Unit 2204468
- 11868 N Elm Grove Rd
- 11374 N Elm Grove Rd
- 16548 E Red Fuller Rd
- 11191 N 510 Rd
- 11378 N Elm Grove Rd
- 11275 N 510 Rd
- 12194 N Elm Grove Rd
- 17443 E 690 Rd
- 17361 E 690 Rd
- 12245 N Elm Grove Rd
- 16367 E Red Fuller Rd
- 17802 E 690 Rd
- 17959 E 690 Rd
- 16975 E 690 Rd
- 18033 E 690 Rd