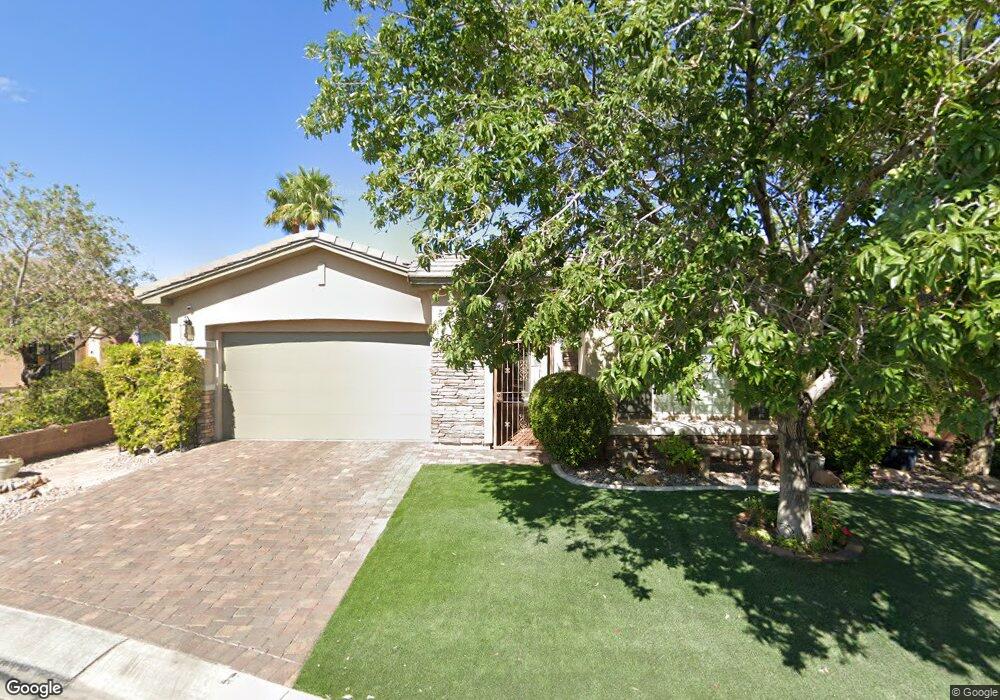
11756 Feinberg Place Las Vegas, NV 89138
Estimated Value: $885,868 - $1,096,000
3
Beds
3
Baths
2,641
Sq Ft
$368/Sq Ft
Est. Value
About This Home
This home is located at 11756 Feinberg Place, Las Vegas, NV 89138 and is currently estimated at $971,217, approximately $367 per square foot. 11756 Feinberg Place is a home located in Clark County with nearby schools including Linda Rankin Givens Elementary School, Sig Rogich Middle School, and Palo Verde High School.
Ownership History
Date
Name
Owned For
Owner Type
Purchase Details
Closed on
Jun 28, 2023
Sold by
Hardin Carleton E and Hardin Hideko Kathleen
Bought by
Carleton E Hardin Jr And Hideko Kathleen Sato and Hardin
Current Estimated Value
Purchase Details
Closed on
Aug 17, 2015
Sold by
Sato Hideko Kathleen
Bought by
Hardin Carleton E and Sato Hideko Kathleen
Home Financials for this Owner
Home Financials are based on the most recent Mortgage that was taken out on this home.
Original Mortgage
$378,500
Interest Rate
4.05%
Mortgage Type
New Conventional
Purchase Details
Closed on
May 30, 2003
Sold by
Pn Ii Inc
Bought by
Sato Hideko Kathleen
Home Financials for this Owner
Home Financials are based on the most recent Mortgage that was taken out on this home.
Original Mortgage
$306,700
Interest Rate
5.75%
Mortgage Type
Unknown
Create a Home Valuation Report for This Property
The Home Valuation Report is an in-depth analysis detailing your home's value as well as a comparison with similar homes in the area
Home Values in the Area
Average Home Value in this Area
Purchase History
| Date | Buyer | Sale Price | Title Company |
|---|---|---|---|
| Carleton E Hardin Jr And Hideko Kathleen Sato | -- | None Listed On Document | |
| Hardin Carleton E | -- | Equity Title Of Nevada | |
| Sato Hideko Kathleen | $383,376 | Lawyers Title Of Nevada |
Source: Public Records
Mortgage History
| Date | Status | Borrower | Loan Amount |
|---|---|---|---|
| Previous Owner | Hardin Carleton E | $378,500 | |
| Previous Owner | Sato Hideko Kathleen | $406,000 | |
| Previous Owner | Sato Hideko Kathleen | $100,000 | |
| Previous Owner | Sato Hideko Kathleen | $306,700 |
Source: Public Records
Tax History Compared to Growth
Tax History
| Year | Tax Paid | Tax Assessment Tax Assessment Total Assessment is a certain percentage of the fair market value that is determined by local assessors to be the total taxable value of land and additions on the property. | Land | Improvement |
|---|---|---|---|---|
| 2025 | $5,088 | $233,955 | $85,400 | $148,555 |
| 2024 | $4,940 | $233,955 | $85,400 | $148,555 |
| 2023 | $4,000 | $200,785 | $62,300 | $138,485 |
| 2022 | $4,765 | $179,892 | $53,200 | $126,692 |
| 2021 | $4,624 | $168,761 | $48,300 | $120,461 |
| 2020 | $4,487 | $163,731 | $44,450 | $119,281 |
| 2019 | $4,355 | $161,543 | $44,100 | $117,443 |
| 2018 | $4,225 | $151,661 | $38,500 | $113,161 |
| 2017 | $4,881 | $148,705 | $34,300 | $114,405 |
| 2016 | $4,000 | $144,914 | $29,750 | $115,164 |
| 2015 | $3,993 | $137,444 | $24,500 | $112,944 |
| 2014 | $3,876 | $114,522 | $15,050 | $99,472 |
Source: Public Records
Map
Nearby Homes
- 216 Muldowney Ln
- 11834 Albissola Ave
- 11815 Corenzio Ave
- 11849 Saverio Ave
- 11826 Corenzio Ave
- 11831 Giroma Ave
- 11813 Pippa Ave
- 11741 Stonewall Springs Ave
- 11730 Stonewall Springs Ave
- 59 Berneri Dr
- 43 Berneri Dr
- 97 Sarabeth St
- 342 Molinetto St
- 11554 Trevi Fountain Ave
- 36 Alamere Falls Dr
- 11589 Caldicot Dr
- 225 Robledo St
- 11909 Pippa Ave
- 251 Castellari Dr
- 133 Lisett St
- 11752 Feinberg Place
- 11760 Feinberg Place
- 11725 La Mirago Place Unit 3
- 11748 Feinberg Place
- 11729 La Mirago Place
- 201 Muldowney Ln
- 11721 La Mirago Place
- 11757 Feinberg Place
- 205 Muldowney Ln
- 11744 Feinberg Place
- 11753 Feinberg Place
- 11717 La Mirago Place
- 81 Teahouse St
- 11745 Feinberg Place
- 209 Muldowney Ln
- 11713 La Mirago Place
- 11740 Feinberg Place
- 212 Muldowney Ln
- 76 Teahouse St
- 11741 Feinberg Place