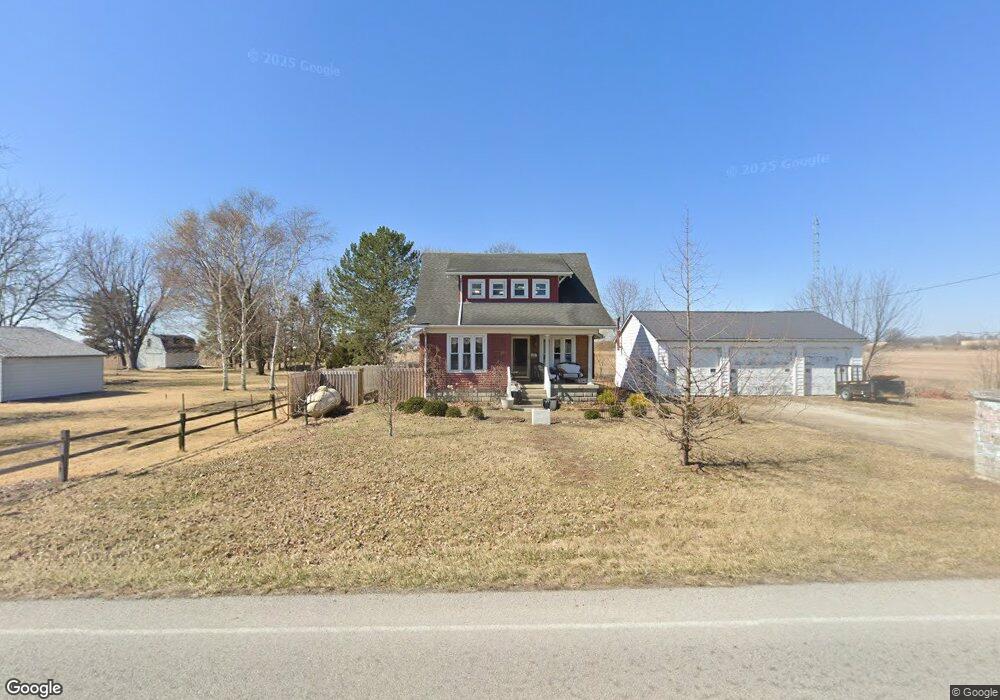
11758 County Road 9 Findlay, OH 45840
Estimated Value: $213,000 - $287,000
3
Beds
3
Baths
1,690
Sq Ft
$152/Sq Ft
Est. Value
About This Home
This home is located at 11758 County Road 9, Findlay, OH 45840 and is currently estimated at $257,307, approximately $152 per square foot. 11758 County Road 9 is a home located in Hancock County with nearby schools including Liberty-Benton Elementary School, Liberty-Benton Middle School, and Liberty-Benton High School.
Ownership History
Date
Name
Owned For
Owner Type
Purchase Details
Closed on
May 29, 2019
Sold by
Bishop Dennis J
Bought by
Bishop Golda L
Current Estimated Value
Home Financials for this Owner
Home Financials are based on the most recent Mortgage that was taken out on this home.
Original Mortgage
$118,000
Outstanding Balance
$103,751
Interest Rate
4.1%
Mortgage Type
New Conventional
Estimated Equity
$153,556
Purchase Details
Closed on
Nov 17, 2003
Sold by
Huysman L Maxine and Thomas Jean A
Bought by
Bishop Dennis J and Bishop Ronda Sue
Home Financials for this Owner
Home Financials are based on the most recent Mortgage that was taken out on this home.
Original Mortgage
$62,000
Interest Rate
6.01%
Mortgage Type
Purchase Money Mortgage
Purchase Details
Closed on
Mar 22, 1990
Bought by
Huysman Arthur and Huysman Maxine L
Create a Home Valuation Report for This Property
The Home Valuation Report is an in-depth analysis detailing your home's value as well as a comparison with similar homes in the area
Home Values in the Area
Average Home Value in this Area
Purchase History
| Date | Buyer | Sale Price | Title Company |
|---|---|---|---|
| Bishop Golda L | $170,000 | Mid American Title Agcy Inc | |
| Bishop Dennis J | $77,500 | Hancock Title | |
| Huysman Arthur | -- | -- |
Source: Public Records
Mortgage History
| Date | Status | Borrower | Loan Amount |
|---|---|---|---|
| Open | Bishop Golda L | $118,000 | |
| Previous Owner | Bishop Dennis J | $62,000 |
Source: Public Records
Tax History Compared to Growth
Tax History
| Year | Tax Paid | Tax Assessment Tax Assessment Total Assessment is a certain percentage of the fair market value that is determined by local assessors to be the total taxable value of land and additions on the property. | Land | Improvement |
|---|---|---|---|---|
| 2024 | $2,204 | $59,290 | $7,140 | $52,150 |
| 2023 | $2,152 | $59,290 | $7,140 | $52,150 |
| 2022 | $2,131 | $59,290 | $7,140 | $52,150 |
| 2021 | $1,505 | $36,950 | $5,710 | $31,240 |
| 2020 | $1,517 | $36,950 | $5,710 | $31,240 |
| 2019 | $1,458 | $36,950 | $5,710 | $31,240 |
| 2018 | $1,191 | $33,380 | $4,760 | $28,620 |
| 2017 | $617 | $33,380 | $4,760 | $28,620 |
| 2016 | $1,203 | $33,380 | $4,760 | $28,620 |
| 2015 | $1,056 | $28,840 | $4,760 | $24,080 |
| 2014 | $1,068 | $28,840 | $4,760 | $24,080 |
| 2012 | $1,022 | $26,450 | $4,760 | $21,690 |
Source: Public Records
Map
Nearby Homes
- 10601 County Road 9
- 11741 Township Road 10
- 1609 Foraker Ave
- 0 Township Road 77
- 3323 Western Ave
- 0 Bushwillow Dr Unit Lot 156
- 0 Bushwillow Dr Unit Lot 155
- 0 Bushwillow Dr Unit Lot 154
- 0 County Road 99 Lot 2 Unit 6081480
- 0 Rock Candy Rd Or Bushwillow Dr Lot 173 Unit 6079093
- 0 Rock Candy Rd Lot 171 Unit 6079088
- 0 Rock Candy Rd Lot 170 Unit 6079087
- 0 Rock Candy Rd Lot 168 Unit 6079085
- 0 Bearcat Way Or 0 Rock Candy Rd Lot 167 Unit 6079083
- 0 Rock Candy Rd Lot 162 Unit 6079070
- 0 Rock Candy Rd Lot 159 Unit 6079053
- 0 Bushwillow Dr Or Rock Candy Rd Lot 157 Unit 6079052
- 0 Bushwillow Dr Lot 156 Unit 6079046
- 0 Bushwillow Dr Lot 155 Unit 6079044
- 0 Bushwillow Dr Lot 154 Unit 6079043
- 11790 County Road 9
- 11729 County Road 9
- 9275 County Road 313
- 11415 County Road 9
- 9161 County Road 313
- 12182 County Road 9
- 12192 County Rd 9 County Rd
- 9480 County Road 313
- 12204 County Road 9
- 12204 County Road 9
- 9536 County Road 313
- 12245 County Road 9
- 12258 County Road 9
- 9587 County Road 313
- 12265 County Road 9
- 12286 County Road 9
- 9802 Township Road 50
- 12312 County Road 9
- 12310 County Road 9
- 9630 County Road 313