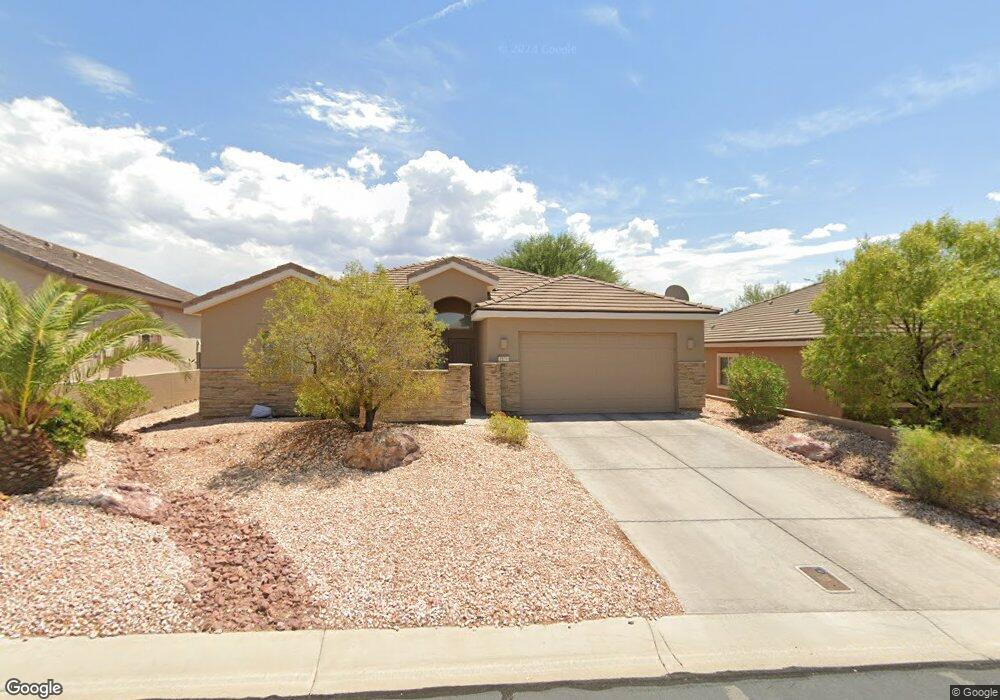
1176 Blind Pew Ridge Mesquite, NV 89027
Estimated Value: $433,511 - $501,000
3
Beds
2
Baths
1,598
Sq Ft
$292/Sq Ft
Est. Value
About This Home
This home is located at 1176 Blind Pew Ridge, Mesquite, NV 89027 and is currently estimated at $467,378, approximately $292 per square foot. 1176 Blind Pew Ridge is a home with nearby schools including Virgin Valley Elementary School, Charles Arthur Hughes Middle School, and Virgin Valley High School.
Ownership History
Date
Name
Owned For
Owner Type
Purchase Details
Closed on
Oct 12, 2023
Sold by
Sypnieski Patrick J and Sypnieski Phyllis A
Bought by
Patrick And Phyllis Sypnieski Family Trust and Sypnieski
Current Estimated Value
Purchase Details
Closed on
Dec 4, 2020
Sold by
Mcgovern Michael
Bought by
Sypnieski Patrick J and Sypnieski Phyllis A
Purchase Details
Closed on
Mar 17, 2011
Sold by
Distinctive Homes Sorrento Llc
Bought by
Mcgovern Michael
Home Financials for this Owner
Home Financials are based on the most recent Mortgage that was taken out on this home.
Original Mortgage
$176,349
Interest Rate
5.02%
Mortgage Type
New Conventional
Purchase Details
Closed on
Aug 29, 2006
Sold by
Canyon Crest Llc
Bought by
Distinctive Homes Sorrento Llc
Create a Home Valuation Report for This Property
The Home Valuation Report is an in-depth analysis detailing your home's value as well as a comparison with similar homes in the area
Home Values in the Area
Average Home Value in this Area
Purchase History
| Date | Buyer | Sale Price | Title Company |
|---|---|---|---|
| Patrick And Phyllis Sypnieski Family Trust | -- | None Listed On Document | |
| Sypnieski Patrick J | $375,000 | Fidelity National Title M | |
| Mcgovern Michael | $220,437 | Equity Title Of Nevada | |
| Distinctive Homes Sorrento Llc | $3,520,180 | Equity Title Of Nevada |
Source: Public Records
Mortgage History
| Date | Status | Borrower | Loan Amount |
|---|---|---|---|
| Previous Owner | Mcgovern Michael | $176,349 |
Source: Public Records
Tax History Compared to Growth
Tax History
| Year | Tax Paid | Tax Assessment Tax Assessment Total Assessment is a certain percentage of the fair market value that is determined by local assessors to be the total taxable value of land and additions on the property. | Land | Improvement |
|---|---|---|---|---|
| 2025 | $2,713 | $127,728 | $37,275 | $90,453 |
| 2024 | $2,635 | $127,728 | $37,275 | $90,453 |
| 2023 | $2,635 | $122,838 | $37,800 | $85,038 |
| 2022 | $2,558 | $114,317 | $36,750 | $77,567 |
| 2021 | $2,484 | $104,829 | $31,500 | $73,329 |
| 2020 | $2,410 | $101,294 | $28,875 | $72,419 |
| 2019 | $2,380 | $92,723 | $28,875 | $63,848 |
| 2018 | $2,271 | $90,020 | $27,825 | $62,195 |
| 2017 | $2,308 | $83,207 | $21,000 | $62,207 |
| 2016 | $2,125 | $77,908 | $21,000 | $56,908 |
| 2015 | $2,120 | $74,220 | $21,000 | $53,220 |
| 2014 | $2,059 | $72,111 | $15,750 | $56,361 |
Source: Public Records
Map
Nearby Homes
- 1180 Mesa Verde Run
- 1222 Blind Pew Ridge
- Residence 2188 Plan at Montrose at Canyon Crest
- Residence 1974 Plan at Montrose at Canyon Crest
- Residence 1833 Plan at Montrose at Canyon Crest
- Residence 1729 Plan at Montrose at Canyon Crest
- Residence 1502 Plan at Montrose at Canyon Crest
- 140 Admiral Benbow Way
- 1348 Mariposa Way
- 490 Ruby Dr
- 1414 Pomegranate Trail
- 957 Diamond Cir
- 744 Pinnacle Ct
- 565 Desert Tortoise Way
- 845 Mesquite Springs Dr Unit 102
- 845 Mesquite Springs Dr Unit 101
- 813 Mesquite Springs Dr Unit 101
- 520 Hamilton Dr
- 521 Hamilton Dr
- 541 Jefferson Ln Unit lot 34
- 1170 Blind Pew Ridge
- 1182 Blind Pew Ridge
- 1164 Blind Pew Ridge
- 1188 Blind Pew Ridge
- 1175 Blind Pew Ridge
- 1185 Blind Pew Ridge
- 1169 Blind Pew Ridge
- 1194 Blind Pew Ridge
- 1158 Blind Pew Ridge
- 1152 Blind Pew Ridge
- 1200 Blind Pew Ridge
- 1190 Cold Creek Bend
- 1199 Cold Creek Bend
- 1159 Cold Creek Bend
- 1197 Cold Creek Bend
- 1195 Cold Creek Bend
- 1206 Blind Pew Ridge
- 1146 Blind Pew Ridge
- 1163 Cold Creek Bend
- 1191 Cold Creek Bend