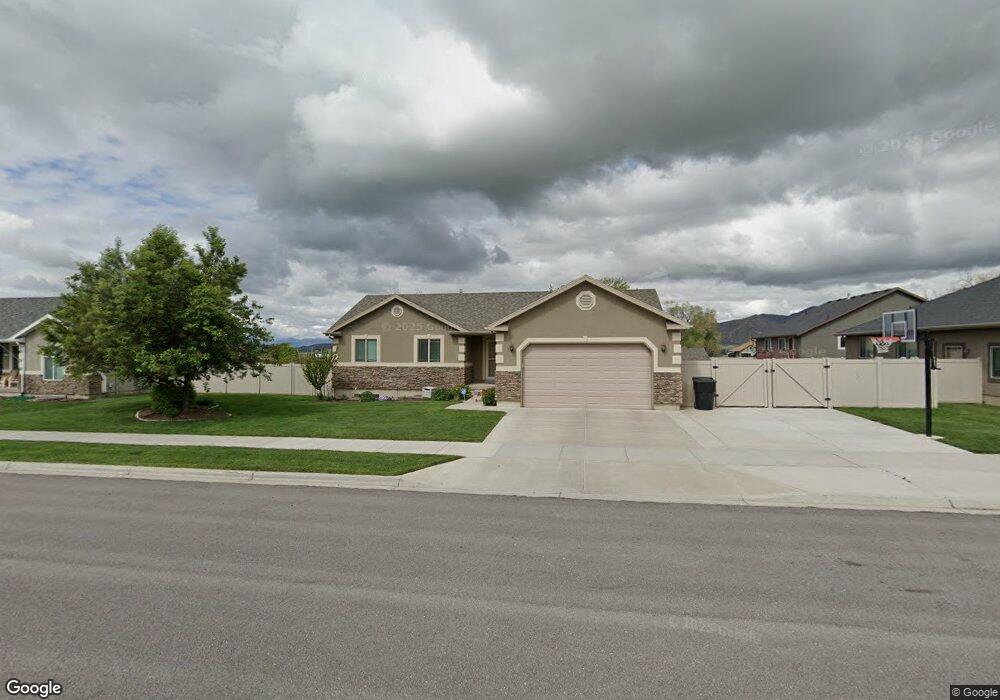
1176 S 520 W Payson, UT 84651
Estimated Value: $435,000 - $507,000
3
Beds
2
Baths
1,328
Sq Ft
$368/Sq Ft
Est. Value
About This Home
This home is located at 1176 S 520 W, Payson, UT 84651 and is currently estimated at $488,675, approximately $367 per square foot. 1176 S 520 W is a home with nearby schools including Spring Lake Elementary, Payson Junior High School, and Payson High School.
Ownership History
Date
Name
Owned For
Owner Type
Purchase Details
Closed on
Dec 22, 2017
Sold by
Rogers Derick B and Rogers Patricia E
Bought by
Rogers Patricia and Rogers Derick
Current Estimated Value
Home Financials for this Owner
Home Financials are based on the most recent Mortgage that was taken out on this home.
Original Mortgage
$209,000
Outstanding Balance
$176,005
Interest Rate
3.95%
Mortgage Type
New Conventional
Estimated Equity
$312,670
Purchase Details
Closed on
Jul 2, 2009
Sold by
Rural Housing Development Corporation
Bought by
Rogers Derick B and Rogers Patricia E
Home Financials for this Owner
Home Financials are based on the most recent Mortgage that was taken out on this home.
Original Mortgage
$183,500
Interest Rate
4.79%
Mortgage Type
Purchase Money Mortgage
Create a Home Valuation Report for This Property
The Home Valuation Report is an in-depth analysis detailing your home's value as well as a comparison with similar homes in the area
Home Values in the Area
Average Home Value in this Area
Purchase History
| Date | Buyer | Sale Price | Title Company |
|---|---|---|---|
| Rogers Patricia | -- | Pro Title & Escrow Inc | |
| Rogers Derick B | -- | Backman Title Services Ltd |
Source: Public Records
Mortgage History
| Date | Status | Borrower | Loan Amount |
|---|---|---|---|
| Open | Rogers Patricia | $209,000 | |
| Closed | Rogers Derick B | $183,500 |
Source: Public Records
Tax History Compared to Growth
Tax History
| Year | Tax Paid | Tax Assessment Tax Assessment Total Assessment is a certain percentage of the fair market value that is determined by local assessors to be the total taxable value of land and additions on the property. | Land | Improvement |
|---|---|---|---|---|
| 2025 | $2,385 | $262,405 | $177,600 | $299,500 |
| 2024 | $2,385 | $242,715 | $0 | $0 |
| 2023 | $2,430 | $247,940 | $0 | $0 |
| 2022 | $2,469 | $247,830 | $0 | $0 |
| 2021 | $2,087 | $336,000 | $116,600 | $219,400 |
| 2020 | $1,977 | $311,400 | $106,000 | $205,400 |
| 2019 | $1,815 | $293,100 | $87,700 | $205,400 |
| 2018 | $1,663 | $258,800 | $76,800 | $182,000 |
| 2017 | $1,561 | $130,680 | $0 | $0 |
| 2016 | $1,472 | $122,375 | $0 | $0 |
| 2015 | $1,398 | $115,445 | $0 | $0 |
| 2014 | $1,231 | $102,355 | $0 | $0 |
Source: Public Records
Map
Nearby Homes
- 1161 Utah 198
- 1087 S 680 W
- 1163 S 730 W
- 1172 S 880 W
- 588 W 1450 S
- 802 Brookside Ct
- 1408 S 30 E
- 598 W Saddlebrook Dr
- 1287 S 1080 W
- 1872 100 E Unit 6
- 1002 W Temple Rim Ln
- 513 W 600 S
- 1128 W 1150 S Unit 9
- 288 E 950 S
- 1582 S 790 W
- 1216 S 1150 W Unit 19
- 1592 S 790 W
- 1579 S 910 W
- 626 S 800 W Unit 32
- 1338 S 1150 W