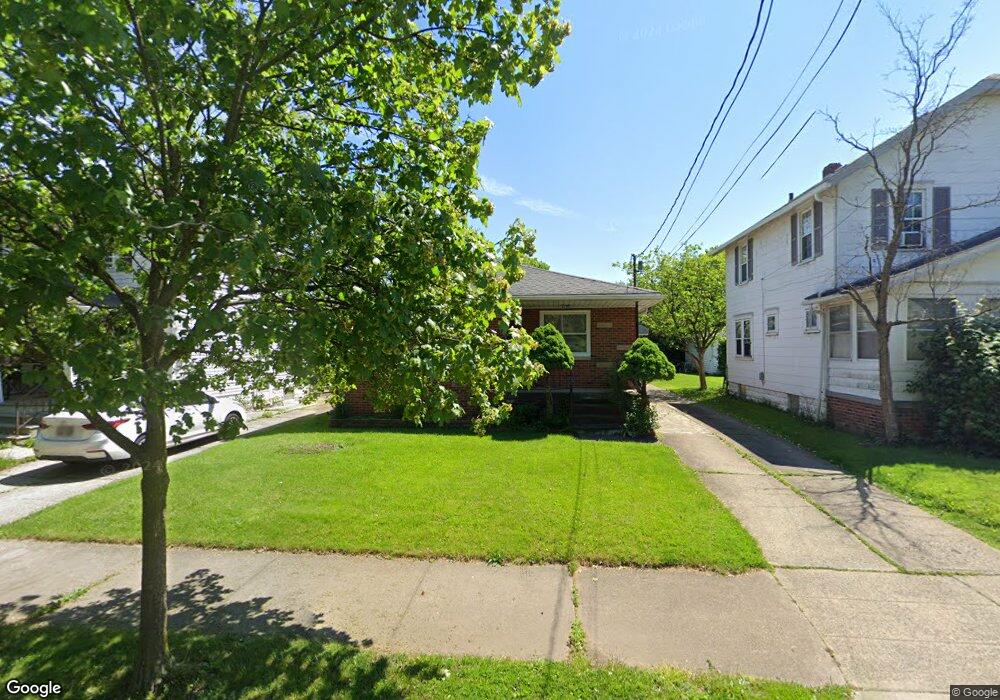
1177 Beardsley St Akron, OH 44301
South Akron NeighborhoodEstimated Value: $73,000 - $112,605
3
Beds
2
Baths
1,126
Sq Ft
$86/Sq Ft
Est. Value
About This Home
This home is located at 1177 Beardsley St, Akron, OH 44301 and is currently estimated at $96,901, approximately $86 per square foot. 1177 Beardsley St is a home located in Summit County with nearby schools including McEbright Elementary School, Kenmore Garfield Community Learning Center, and Main Preparatory Academy.
Ownership History
Date
Name
Owned For
Owner Type
Purchase Details
Closed on
Jan 22, 2010
Sold by
Shaung Mehm and Soi Kun
Bought by
Secretary Of Hud
Current Estimated Value
Purchase Details
Closed on
Feb 23, 2009
Sold by
Secretary Of Housing & Urban Development
Bought by
Shaung Mehm and Soi Kun
Home Financials for this Owner
Home Financials are based on the most recent Mortgage that was taken out on this home.
Original Mortgage
$31,018
Interest Rate
4.91%
Mortgage Type
FHA
Purchase Details
Closed on
Oct 28, 2008
Sold by
Lauber Tracy L
Bought by
Secretary Of Housing & Urban Development
Purchase Details
Closed on
Oct 26, 2005
Sold by
Wright Jane L
Bought by
Lauber Tracy L
Home Financials for this Owner
Home Financials are based on the most recent Mortgage that was taken out on this home.
Original Mortgage
$93,989
Interest Rate
5.8%
Mortgage Type
FHA
Create a Home Valuation Report for This Property
The Home Valuation Report is an in-depth analysis detailing your home's value as well as a comparison with similar homes in the area
Home Values in the Area
Average Home Value in this Area
Purchase History
| Date | Buyer | Sale Price | Title Company |
|---|---|---|---|
| Secretary Of Hud | -- | None Available | |
| Shaung Mehm | $35,000 | Lakeside Title & Escrow Agen | |
| Secretary Of Housing & Urban Development | -- | Attorney | |
| Lauber Tracy L | $95,500 | First American Title Ins Co |
Source: Public Records
Mortgage History
| Date | Status | Borrower | Loan Amount |
|---|---|---|---|
| Closed | Shaung Mehm | $31,018 | |
| Previous Owner | Lauber Tracy L | $93,989 |
Source: Public Records
Tax History
| Year | Tax Paid | Tax Assessment Tax Assessment Total Assessment is a certain percentage of the fair market value that is determined by local assessors to be the total taxable value of land and additions on the property. | Land | Improvement |
|---|---|---|---|---|
| 2024 | $1,478 | $27,419 | $5,285 | $22,134 |
| 2023 | $1,478 | $27,419 | $5,285 | $22,134 |
| 2022 | $1,446 | $21,060 | $4,004 | $17,056 |
| 2021 | $1,447 | $21,060 | $4,004 | $17,056 |
| 2020 | $1,426 | $21,060 | $4,000 | $17,060 |
| 2019 | $1,447 | $19,430 | $4,350 | $15,080 |
| 2018 | $1,428 | $19,430 | $4,350 | $15,080 |
| 2017 | $1,654 | $19,430 | $4,350 | $15,080 |
| 2016 | $1,528 | $20,520 | $4,610 | $15,910 |
| 2015 | $1,654 | $20,520 | $4,610 | $15,910 |
| 2014 | $1,642 | $20,520 | $4,610 | $15,910 |
| 2013 | $1,845 | $23,930 | $4,610 | $19,320 |
Source: Public Records
Map
Nearby Homes
- 436 Cole Ave
- 1241 Wilbur Ave
- 1203 Atwood Ave
- 1100 Beardsley St
- 1212 Tulip St
- 1240 Tulip St
- 413 Stanton Ave
- 1094 Dietz Ave
- 1268 Brown St
- 0 Beardsley St
- 1051 Brown St
- 1243 Dietz Ave
- 485 E Archwood Ave
- 568 Stanton Ave
- 1012 Kling St
- 1243 Herberich Ave
- 1235 Bellows St
- 1133 Bellows St
- 1208 Bellows St Unit 1210
- 422 N Firestone Blvd
- 1173 Beardsley St
- 1181 Beardsley St
- 1169 Beardsley St
- 1185 Beardsley St
- 1174 Lily St
- 1165 Beardsley St
- 1170 Lily St
- 1178 Lily St
- 1191 Beardsley St
- 1166 Lily St
- 1182 Lily St
- 1161 Beardsley St
- 1174 Beardsley St
- 1180 Beardsley St
- 1162 Lily St
- 1186 Lily St
- 1170 Beardsley St
- 1184 Beardsley St
- 1166 Beardsley St
- 1188 Beardsley St
Your Personal Tour Guide
Ask me questions while you tour the home.