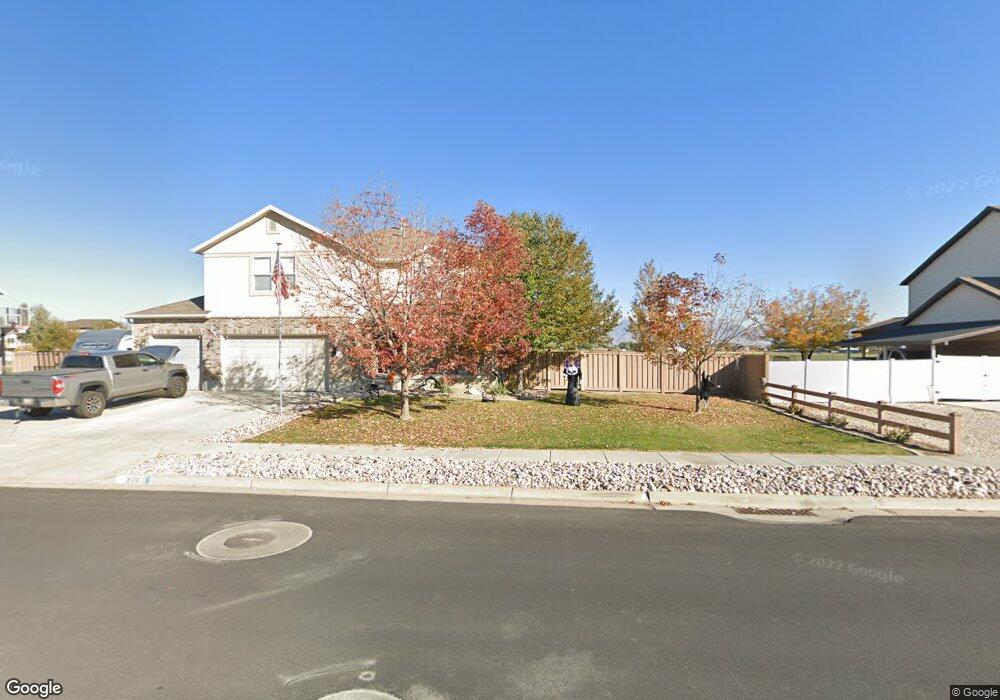
1177 W 2500 S Syracuse, UT 84075
Estimated Value: $596,000 - $777,000
3
Beds
3
Baths
4,126
Sq Ft
$174/Sq Ft
Est. Value
About This Home
This home is located at 1177 W 2500 S, Syracuse, UT 84075 and is currently estimated at $719,931, approximately $174 per square foot. 1177 W 2500 S is a home located in Davis County with nearby schools including Bluff Ridge Elementary, Legacy Junior High School, and Clearfield High School.
Ownership History
Date
Name
Owned For
Owner Type
Purchase Details
Closed on
Jan 20, 1998
Sold by
Farr Don
Bought by
Green Allen Roger and Green Patti B
Current Estimated Value
Home Financials for this Owner
Home Financials are based on the most recent Mortgage that was taken out on this home.
Original Mortgage
$220,000
Outstanding Balance
$38,148
Interest Rate
7.13%
Estimated Equity
$681,783
Purchase Details
Closed on
Apr 15, 1997
Sold by
Jade Development Inc
Bought by
Farr Don R
Home Financials for this Owner
Home Financials are based on the most recent Mortgage that was taken out on this home.
Original Mortgage
$225,750
Interest Rate
7.86%
Mortgage Type
Construction
Create a Home Valuation Report for This Property
The Home Valuation Report is an in-depth analysis detailing your home's value as well as a comparison with similar homes in the area
Home Values in the Area
Average Home Value in this Area
Purchase History
| Date | Buyer | Sale Price | Title Company |
|---|---|---|---|
| Green Allen Roger | -- | Bonneville Title Company Inc | |
| Farr Don R | -- | Bonneville Title Company Inc |
Source: Public Records
Mortgage History
| Date | Status | Borrower | Loan Amount |
|---|---|---|---|
| Open | Green Allen Roger | $220,000 | |
| Previous Owner | Farr Don R | $225,750 | |
| Closed | Farr Don R | $9,175 |
Source: Public Records
Tax History Compared to Growth
Tax History
| Year | Tax Paid | Tax Assessment Tax Assessment Total Assessment is a certain percentage of the fair market value that is determined by local assessors to be the total taxable value of land and additions on the property. | Land | Improvement |
|---|---|---|---|---|
| 2025 | $4,173 | $402,600 | $129,005 | $273,595 |
| 2024 | $4,111 | $399,300 | $110,670 | $288,630 |
| 2023 | $3,757 | $665,000 | $153,973 | $511,027 |
| 2022 | $3,565 | $345,950 | $88,080 | $257,870 |
| 2021 | $3,016 | $453,000 | $130,620 | $322,380 |
| 2020 | $2,813 | $409,000 | $111,779 | $297,221 |
| 2019 | $2,724 | $391,000 | $111,715 | $279,285 |
| 2018 | $2,737 | $390,000 | $106,567 | $283,433 |
| 2016 | $2,517 | $188,100 | $40,812 | $147,288 |
| 2015 | $2,696 | $191,840 | $40,812 | $151,028 |
| 2014 | $2,647 | $191,997 | $40,812 | $151,185 |
| 2013 | -- | $178,614 | $39,165 | $139,449 |
Source: Public Records
Map
Nearby Homes
- 1137 W 2500 S
- 2480 S 1150 W
- 2766 S 1200 W
- 1295 W 2325 S
- 1196 W 2325 S
- 1156 W 2325 S
- 2355 S 1230 W
- 1315 W 2325 S
- 1116 W 2325 S
- 1137 2275 S
- 1286 W 2325 S
- 1137 W 2275 S
- 1306 W 2325 S
- 921 W 2700 S
- 2232 S 1000 W
- 904 W 2300 S
- 803 W 2800 S
- 2742 S Allison Way Unit 212
- 1079 W 2050 S
- 2734 S Allison Way Unit 213
- 1155 W 2500 S
- 1195 W 2500 S
- 1188 W 2500 S
- 1166 W 2615 S
- 2490 S 1150 W
- 1164 W 2500 S
- 2487 S 1200 W
- 2610 S 1175 W
- 1146 W 2615 S
- 2786 S 1200 W
- 2509 S 1225 W
- 1126 W 2615 S
- 2491 S 1150 W
- 1119 W 2500 S
- 2521 S 1225 W
- 1165 S 1225 W Unit 207
- 1151 S 1225 W Unit 212
- 1148 S 1225 W Unit 210
- 1133 S 1225 W Unit 211
- 1127 S 1225 W Unit 211