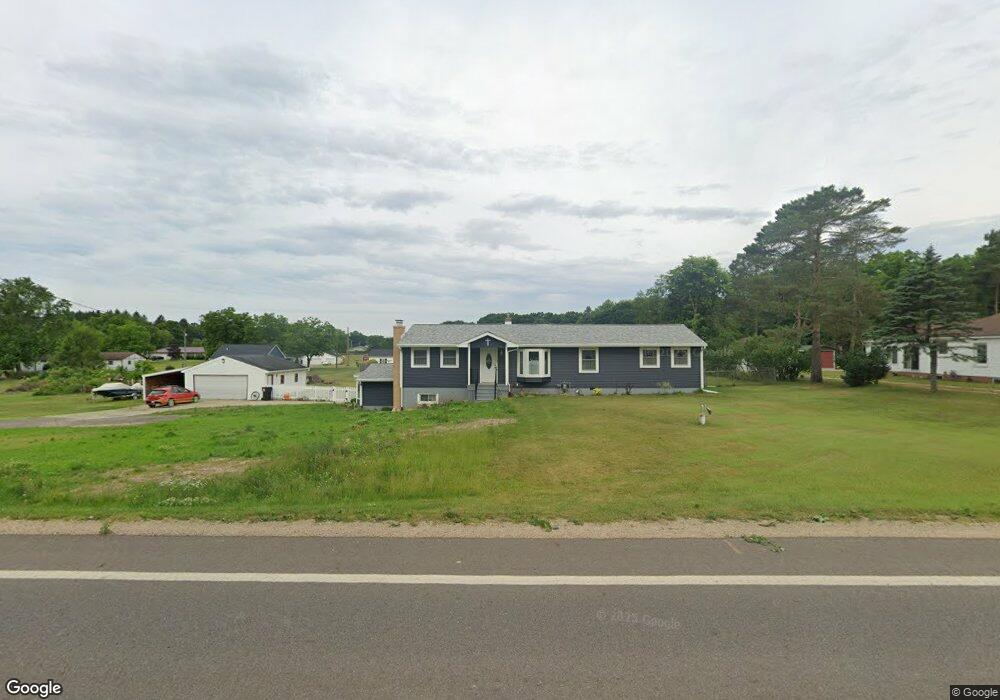
1178 26th St Allegan, MI 49010
Estimated Value: $205,000 - $247,626
--
Bed
2
Baths
1,658
Sq Ft
$140/Sq Ft
Est. Value
About This Home
This home is located at 1178 26th St, Allegan, MI 49010 and is currently estimated at $232,907, approximately $140 per square foot. 1178 26th St is a home located in Allegan County with nearby schools including Pine Trails Elementary School, L.E. White Middle School, and Allegan High School.
Ownership History
Date
Name
Owned For
Owner Type
Purchase Details
Closed on
Nov 23, 2021
Sold by
Blank Suzanne
Bought by
Devries Leisha A
Current Estimated Value
Home Financials for this Owner
Home Financials are based on the most recent Mortgage that was taken out on this home.
Original Mortgage
$130,000
Outstanding Balance
$119,222
Interest Rate
3.05%
Mortgage Type
New Conventional
Estimated Equity
$113,685
Purchase Details
Closed on
Feb 5, 2001
Sold by
Blank Wayne D and Blank Suzanne A
Bought by
Blank Suzanne
Purchase Details
Closed on
Jul 30, 1998
Sold by
Howrigon Richard D and Howrigon Mary
Bought by
Blank Wayne D and Blank Suzanne A
Create a Home Valuation Report for This Property
The Home Valuation Report is an in-depth analysis detailing your home's value as well as a comparison with similar homes in the area
Home Values in the Area
Average Home Value in this Area
Purchase History
| Date | Buyer | Sale Price | Title Company |
|---|---|---|---|
| Devries Leisha A | $160,000 | Chicago Title Of Mi Inc | |
| Blank Suzanne | -- | -- | |
| Blank Wayne D | $113,000 | -- |
Source: Public Records
Mortgage History
| Date | Status | Borrower | Loan Amount |
|---|---|---|---|
| Open | Devries Leisha A | $130,000 |
Source: Public Records
Tax History Compared to Growth
Tax History
| Year | Tax Paid | Tax Assessment Tax Assessment Total Assessment is a certain percentage of the fair market value that is determined by local assessors to be the total taxable value of land and additions on the property. | Land | Improvement |
|---|---|---|---|---|
| 2025 | $2,961 | $110,400 | $15,000 | $95,400 |
| 2024 | $2,748 | $99,600 | $12,500 | $87,100 |
| 2023 | $2,748 | $89,200 | $11,500 | $77,700 |
| 2022 | $2,748 | $83,500 | $10,300 | $73,200 |
| 2021 | $1,770 | $83,200 | $10,300 | $72,900 |
| 2020 | $1,770 | $79,900 | $9,300 | $70,600 |
| 2019 | $0 | $72,300 | $8,500 | $63,800 |
| 2018 | $0 | $63,800 | $8,000 | $55,800 |
| 2017 | $0 | $62,000 | $7,000 | $55,000 |
| 2016 | $0 | $59,100 | $7,800 | $51,300 |
| 2015 | -- | $59,100 | $7,800 | $51,300 |
| 2014 | -- | $54,300 | $7,800 | $46,500 |
| 2013 | -- | $52,700 | $7,800 | $44,900 |
Source: Public Records
Map
Nearby Homes
- 1202 Lincoln Rd
- 1028 26th St
- 0 113th Ave
- 0 24th St
- 2435 108th Ave
- V/L Fawn Path Parcel A
- V/L
- 902 Double Eagle Dr
- 908 Double Eagle Dr
- 3036 Primrose Place
- 2346 116th Ave
- 743 25th St
- V/L Marshall St
- 3138 Valley Vista Ln
- 124 Park Ave
- 111 Depot Hill Ct
- VL Weeks St
- 124 Glenn St
- 1077 Sun Valley Ln
- 2044 110th Ave