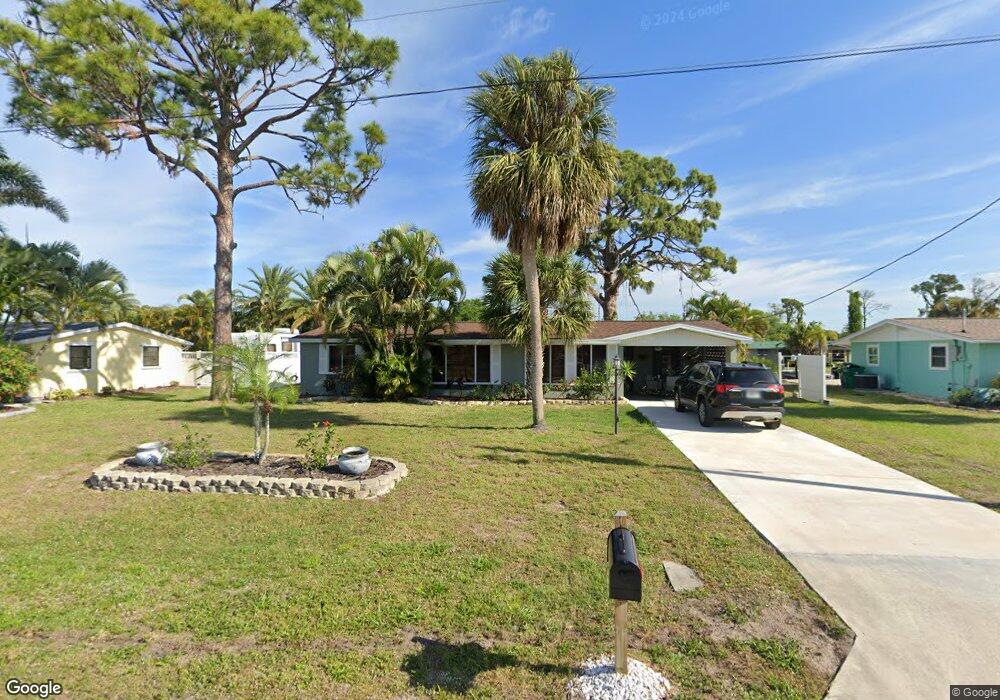
1178 Clark St Englewood, FL 34224
Englewood South NeighborhoodEstimated Value: $222,700 - $441,000
3
Beds
2
Baths
1,540
Sq Ft
$219/Sq Ft
Est. Value
About This Home
This home is located at 1178 Clark St, Englewood, FL 34224 and is currently estimated at $337,425, approximately $219 per square foot. 1178 Clark St is a home located in Charlotte County with nearby schools including Myakka River Elementary School, L.A. Ainger Middle School, and Lemon Bay High School.
Ownership History
Date
Name
Owned For
Owner Type
Purchase Details
Closed on
Sep 14, 2011
Sold by
Payne Robert
Bought by
Payne Liesa
Current Estimated Value
Purchase Details
Closed on
Apr 25, 2003
Sold by
Neitzei Mary H
Bought by
Payne Robert and Payne Liesa
Home Financials for this Owner
Home Financials are based on the most recent Mortgage that was taken out on this home.
Original Mortgage
$98,000
Interest Rate
5.17%
Mortgage Type
Purchase Money Mortgage
Create a Home Valuation Report for This Property
The Home Valuation Report is an in-depth analysis detailing your home's value as well as a comparison with similar homes in the area
Home Values in the Area
Average Home Value in this Area
Purchase History
| Date | Buyer | Sale Price | Title Company |
|---|---|---|---|
| Payne Liesa | -- | Attorney | |
| Payne Robert | -- | -- |
Source: Public Records
Mortgage History
| Date | Status | Borrower | Loan Amount |
|---|---|---|---|
| Previous Owner | Payne Robert | $98,000 |
Source: Public Records
Tax History Compared to Growth
Tax History
| Year | Tax Paid | Tax Assessment Tax Assessment Total Assessment is a certain percentage of the fair market value that is determined by local assessors to be the total taxable value of land and additions on the property. | Land | Improvement |
|---|---|---|---|---|
| 2024 | $1,601 | $97,091 | -- | -- |
| 2023 | $1,601 | $94,263 | $0 | $0 |
| 2022 | $1,528 | $91,517 | $0 | $0 |
| 2021 | $1,494 | $88,851 | $0 | $0 |
| 2020 | $1,459 | $87,624 | $0 | $0 |
| 2019 | $1,542 | $85,654 | $0 | $0 |
| 2018 | $1,415 | $84,057 | $0 | $0 |
| 2017 | $1,395 | $82,328 | $0 | $0 |
| 2016 | $1,251 | $80,635 | $0 | $0 |
| 2015 | $1,228 | $80,074 | $0 | $0 |
| 2014 | $1,198 | $79,438 | $0 | $0 |
Source: Public Records
Map
Nearby Homes