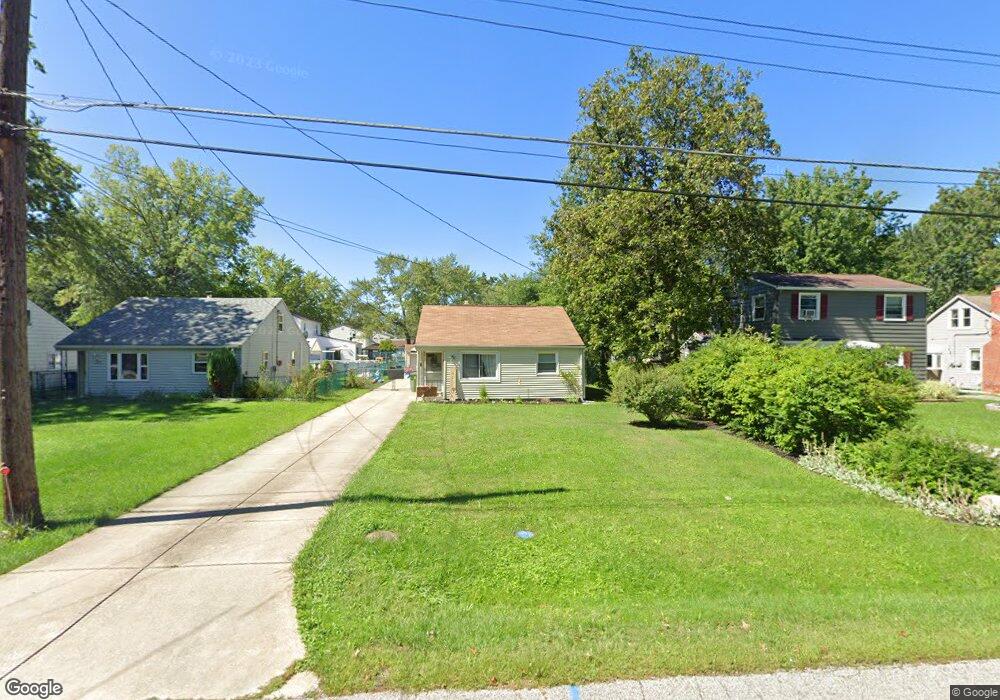
1178 E 357th St Eastlake, OH 44095
Estimated Value: $136,000 - $149,000
2
Beds
1
Bath
784
Sq Ft
$181/Sq Ft
Est. Value
About This Home
This home is located at 1178 E 357th St, Eastlake, OH 44095 and is currently estimated at $142,196, approximately $181 per square foot. 1178 E 357th St is a home located in Lake County with nearby schools including Longfellow Elementary School, Eastlake Middle School, and North High School.
Ownership History
Date
Name
Owned For
Owner Type
Purchase Details
Closed on
Jun 14, 2005
Sold by
Hamilton Kimberly J and Hamilton Kimberly M
Bought by
Yucha Steven S and Huggins Shawna E
Current Estimated Value
Home Financials for this Owner
Home Financials are based on the most recent Mortgage that was taken out on this home.
Original Mortgage
$104,077
Outstanding Balance
$53,497
Interest Rate
5.82%
Mortgage Type
FHA
Estimated Equity
$88,699
Purchase Details
Closed on
Apr 8, 2002
Sold by
Hamilton Michael J
Bought by
Hamilton Kimberly J
Purchase Details
Closed on
Oct 13, 1997
Sold by
Toler Ruth and Toler Ruth V
Bought by
Hamilton Michael J and Hamilton Kimberly M
Home Financials for this Owner
Home Financials are based on the most recent Mortgage that was taken out on this home.
Original Mortgage
$77,914
Interest Rate
7.65%
Mortgage Type
FHA
Purchase Details
Closed on
Oct 7, 1987
Bought by
Toler Ruth
Create a Home Valuation Report for This Property
The Home Valuation Report is an in-depth analysis detailing your home's value as well as a comparison with similar homes in the area
Home Values in the Area
Average Home Value in this Area
Purchase History
| Date | Buyer | Sale Price | Title Company |
|---|---|---|---|
| Yucha Steven S | $104,900 | Multiple | |
| Hamilton Kimberly J | -- | -- | |
| Hamilton Michael J | $78,000 | Midland Title Security Inc | |
| Toler Ruth | -- | -- |
Source: Public Records
Mortgage History
| Date | Status | Borrower | Loan Amount |
|---|---|---|---|
| Open | Yucha Steven S | $104,077 | |
| Closed | Hamilton Michael J | $77,914 |
Source: Public Records
Tax History
| Year | Tax Paid | Tax Assessment Tax Assessment Total Assessment is a certain percentage of the fair market value that is determined by local assessors to be the total taxable value of land and additions on the property. | Land | Improvement |
|---|---|---|---|---|
| 2025 | -- | $44,980 | $13,360 | $31,620 |
| 2024 | -- | $44,980 | $13,360 | $31,620 |
| 2023 | $2,903 | $30,040 | $10,670 | $19,370 |
| 2022 | $2,650 | $30,040 | $10,670 | $19,370 |
| 2021 | $2,603 | $30,040 | $10,670 | $19,370 |
| 2020 | $2,376 | $26,120 | $9,280 | $16,840 |
| 2019 | $2,245 | $26,120 | $9,280 | $16,840 |
| 2018 | $1,805 | $27,850 | $11,320 | $16,530 |
| 2017 | $1,985 | $27,850 | $11,320 | $16,530 |
| 2016 | $1,899 | $27,850 | $11,320 | $16,530 |
| 2015 | $1,808 | $27,850 | $11,320 | $16,530 |
| 2014 | $1,715 | $27,850 | $11,320 | $16,530 |
| 2013 | $1,715 | $27,850 | $11,320 | $16,530 |
Source: Public Records
Map
Nearby Homes
- 1222 E 360th St
- 1295 E 357th St
- 36405 Stevens Blvd
- 1259 E 351st St
- 0 E 362nd St
- 36001 Freed Ct
- 1045 E 347th St
- 1334 E 346th St
- 35477 Hobbie Dr
- 847 Audrey Dr
- 35288 Beach Park Ave
- 771 E 348th St
- 1085 Stevens Blvd
- 1096 Stevens Blvd
- 400 Taft Dr
- 1313 Waverly Rd
- 1344 Waverly Rd
- 34857 Roberts Rd
- 34233 Beach Park Ave
- 4138 Buckeye Ave
- 1184 E 357th St
- 1172 E 357th St
- 1192 E 357th St
- 35605 Blanch Ave
- 1164 E 357th St
- 35587 Blanch Ave
- 1158 E 357th St
- V/L V/L Meyer Ave
- 1177 E 357th St
- 1206 E 357th St
- 35555 Blanch Ave
- 1189 E 357th St
- 1148 E 357th St
- VL E 357th St
- 1214 E 357th St
- 35624 Blanch Ave
- 35531 Blanch Ave
- 1140 E 357th St
- 1167 E 357th St
- 1203 E 357th St
Your Personal Tour Guide
Ask me questions while you tour the home.