D
Seller's Agent in 2025
David Kortokrax
Key Realty- Findlay
(419) 466-0148
64 Total Sales
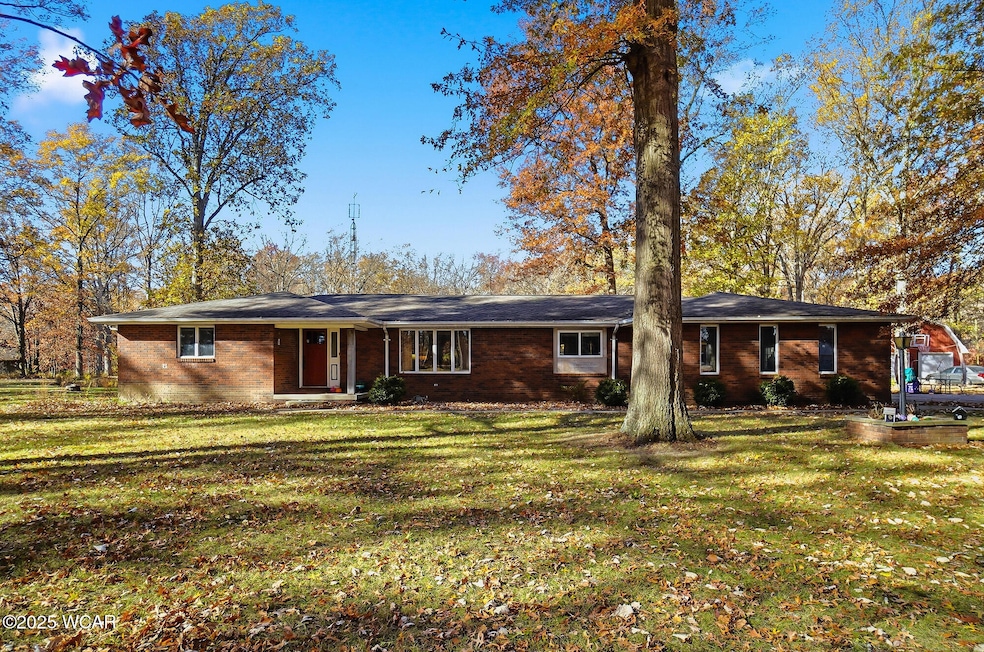
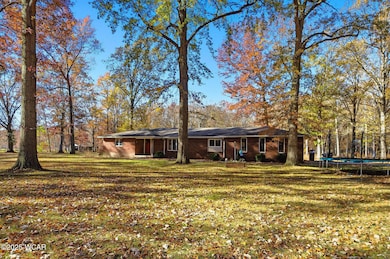
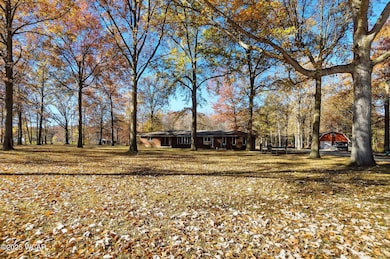
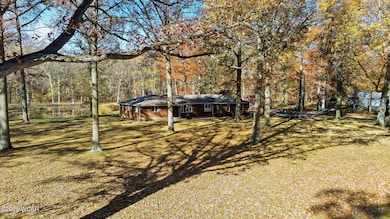
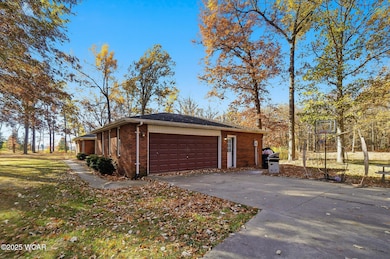
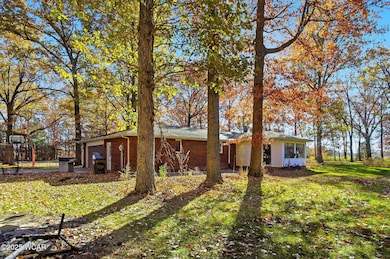
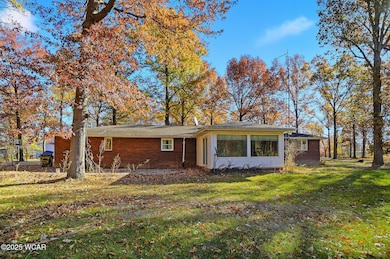
Welcome to 11785 Rd 171 ! This property is sure to please! 4.39 acres with mature trees surrounding the house and a wooded area behind the 1/2 acre 15' deep pond. The full concrete drive will lead you through the large trees back to the serene setting and the 2104 square foot all brick ranch. The home has been transformed from a ''traditional'' ranch to a more modern open concept feel with a large open space, an updated kitchen and a large island for all your entertaining needs. Home has a recently installed geothermal system and water heater. The 32x26 2 car, 2 story man shed is just an added bonus to this perfect property. Don't miss out on this one!
Last Agent to Sell the Property
Key Realty- Findlay License #2018000568 Listed on: 11/20/2025

| Date | Type | Sale Price | Title Company |
|---|---|---|---|
| Warranty Deed | $72,000 | None Listed On Document | |
| Warranty Deed | $170,000 | None Available | |
| Warranty Deed | $215,000 | Title Source Inc | |
| Warranty Deed | $130,000 | None Available | |
| Deed | -- | -- | |
| Deed | -- | -- |
| Date | Status | Loan Amount | Loan Type |
|---|---|---|---|
| Open | $188,000 | New Conventional | |
| Previous Owner | $211,105 | FHA | |
| Previous Owner | $129,575 | Future Advance Clause Open End Mortgage | |
| Previous Owner | $132,000 | Future Advance Clause Open End Mortgage |
| Date | Event | Price | List to Sale | Price per Sq Ft |
|---|---|---|---|---|
| 12/22/2025 12/22/25 | Sold | $288,000 | -10.0% | $137 / Sq Ft |
| 11/25/2025 11/25/25 | Pending | -- | -- | -- |
| 11/20/2025 11/20/25 | For Sale | $320,000 | -- | $152 / Sq Ft |
| Year | Tax Paid | Tax Assessment Tax Assessment Total Assessment is a certain percentage of the fair market value that is determined by local assessors to be the total taxable value of land and additions on the property. | Land | Improvement |
|---|---|---|---|---|
| 2025 | $2,999 | $89,570 | $13,300 | $76,270 |
| 2024 | $2,999 | $77,880 | $11,550 | $66,330 |
| 2023 | $2,737 | $77,880 | $11,550 | $66,330 |
| 2022 | $2,722 | $77,880 | $11,550 | $66,330 |
| 2021 | $2,192 | $57,900 | $10,960 | $46,940 |
| 2020 | $2,262 | $57,900 | $10,960 | $46,940 |
| 2019 | $2,281 | $49,740 | $10,960 | $38,780 |
| 2018 | $1,974 | $49,740 | $10,960 | $38,780 |
| 2017 | $1,965 | $49,460 | $10,960 | $38,500 |
| 2016 | $1,965 | $49,460 | $10,960 | $38,500 |
| 2015 | $1,850 | $47,120 | $9,420 | $37,700 |
| 2014 | $1,816 | $47,120 | $9,420 | $37,700 |
| 2013 | $2,015 | $47,120 | $9,420 | $37,700 |
D
Seller's Agent in 2025
David Kortokrax
Key Realty- Findlay
(419) 466-0148
64 Total Sales
R
Buyer's Agent in 2025
Ryan Staley
CCR Realtors
(419) 296-3787
91 Total Sales
Source: West Central Association of REALTORS® (OH)
MLS Number: 308875
APN: 08-08S-014-00
Ask me questions while you tour the home.