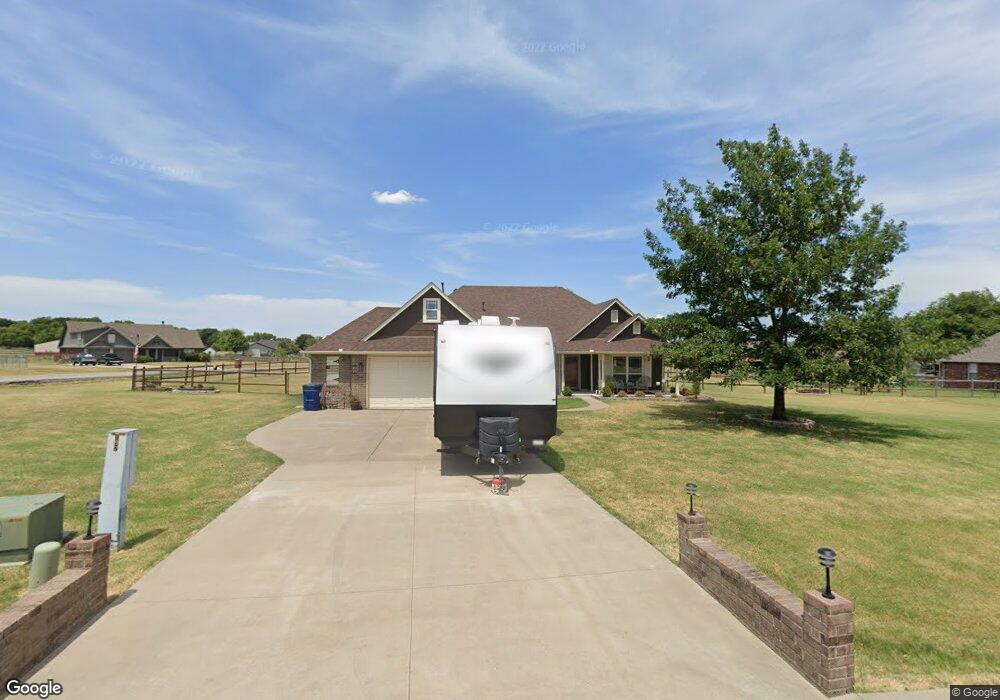
11787 Sandstone Dr Collinsville, OK 74021
Estimated Value: $296,000 - $343,000
3
Beds
2
Baths
1,847
Sq Ft
$174/Sq Ft
Est. Value
About This Home
This home is located at 11787 Sandstone Dr, Collinsville, OK 74021 and is currently estimated at $321,439, approximately $174 per square foot. 11787 Sandstone Dr is a home located in Rogers County with nearby schools including Northeast Elementary School, Owasso 6th Grade Center, and Owasso 8th Grade Center.
Ownership History
Date
Name
Owned For
Owner Type
Purchase Details
Closed on
Nov 28, 2012
Sold by
Boone Thomas G and Boone Teresa A
Bought by
Boone Thomas G and The Thomas G Boone Revocable I
Current Estimated Value
Home Financials for this Owner
Home Financials are based on the most recent Mortgage that was taken out on this home.
Original Mortgage
$12,000
Outstanding Balance
$2,135
Interest Rate
3.42%
Mortgage Type
New Conventional
Estimated Equity
$319,304
Purchase Details
Closed on
Mar 1, 2011
Sold by
Boone Thomas G and Boone Teresa A
Bought by
Boone Thomas G and Thomas G Boone Revocable Inter
Purchase Details
Closed on
May 15, 2003
Sold by
Westerfield Corporation
Purchase Details
Closed on
Dec 11, 2002
Sold by
Cedar Bluff Partners Llc
Purchase Details
Closed on
Oct 18, 2000
Sold by
A&W Land Development Inc
Create a Home Valuation Report for This Property
The Home Valuation Report is an in-depth analysis detailing your home's value as well as a comparison with similar homes in the area
Home Values in the Area
Average Home Value in this Area
Purchase History
| Date | Buyer | Sale Price | Title Company |
|---|---|---|---|
| Boone Thomas G | -- | Tulsa Abstract & Title Compa | |
| Boone Thomas G | $103,000 | Tulsa Abstract & Title Compa | |
| Boone Thomas G | -- | None Available | |
| -- | $158,500 | -- | |
| -- | $24,000 | -- | |
| -- | $580,300 | -- |
Source: Public Records
Mortgage History
| Date | Status | Borrower | Loan Amount |
|---|---|---|---|
| Open | Boone Thomas G | $12,000 | |
| Closed | Boone Thomas G | $12,000 |
Source: Public Records
Tax History Compared to Growth
Tax History
| Year | Tax Paid | Tax Assessment Tax Assessment Total Assessment is a certain percentage of the fair market value that is determined by local assessors to be the total taxable value of land and additions on the property. | Land | Improvement |
|---|---|---|---|---|
| 2025 | $2,661 | $25,415 | $4,371 | $21,044 |
| 2024 | $2,626 | $24,675 | $4,244 | $20,431 |
| 2023 | $2,626 | $23,957 | $3,870 | $20,087 |
| 2022 | $2,513 | $23,259 | $3,740 | $19,519 |
| 2021 | $2,410 | $22,582 | $3,740 | $18,842 |
| 2020 | $2,342 | $22,229 | $3,740 | $18,489 |
| 2019 | $2,272 | $21,351 | $3,740 | $17,611 |
| 2018 | $2,256 | $21,883 | $3,740 | $18,143 |
| 2017 | $2,220 | $21,355 | $3,581 | $17,774 |
| 2016 | $2,154 | $20,734 | $3,300 | $17,434 |
| 2015 | $2,105 | $20,132 | $3,300 | $16,832 |
| 2014 | $2,070 | $19,688 | $3,300 | $16,388 |
Source: Public Records
Map
Nearby Homes
- 19914 E 126th St N
- 11610 N 190th East Ave
- 12192 N 179th East Ave
- 12047 N 193rd East Ave
- 12225 N 194th East Ave
- 17542 E 112th St N
- 16893 E 116th St N
- 11417 N 168th East Ave
- 16550 E 120th St N
- 0 Hobbs Creek Dr Unit 2541616
- 12875 N 193rd East Ave
- 0 E 106th St N Unit 2543814
- 0 E 106th St N Unit 2546711
- 13247 Hobbs Creek Dr
- 4608 E 472 Rd
- 12537 N 165th East Ave
- 11890 S 4050 Rd
- 5 Hobbs Creek Trail
- 11381 N 209th E
- 4728 E Hwy 20
- 11806 Prairie Cir
- 0 Prairie St
- 11767 Sandstone Dr
- 11869 Prairie Cir
- 11752 Sandstone Dr
- 11702 Sandstone Dr
- 11782 Sandstone Dr
- 11792 Sandstone Dr
- 11797 Sandstone Dr
- 11826 Prairie Cir
- 11856 Prairie Cir
- 11747 Sandstone Dr
- 11727 Sandstone Dr
- 11837 Sandstone Dr
- 11886 Prairie Cir
- 11615 Skyline Dr
- 11802 Sandstone Dr
- 11605 Skyline Dr
- 11635 Skyline Dr
- 11635 Skyline Dr