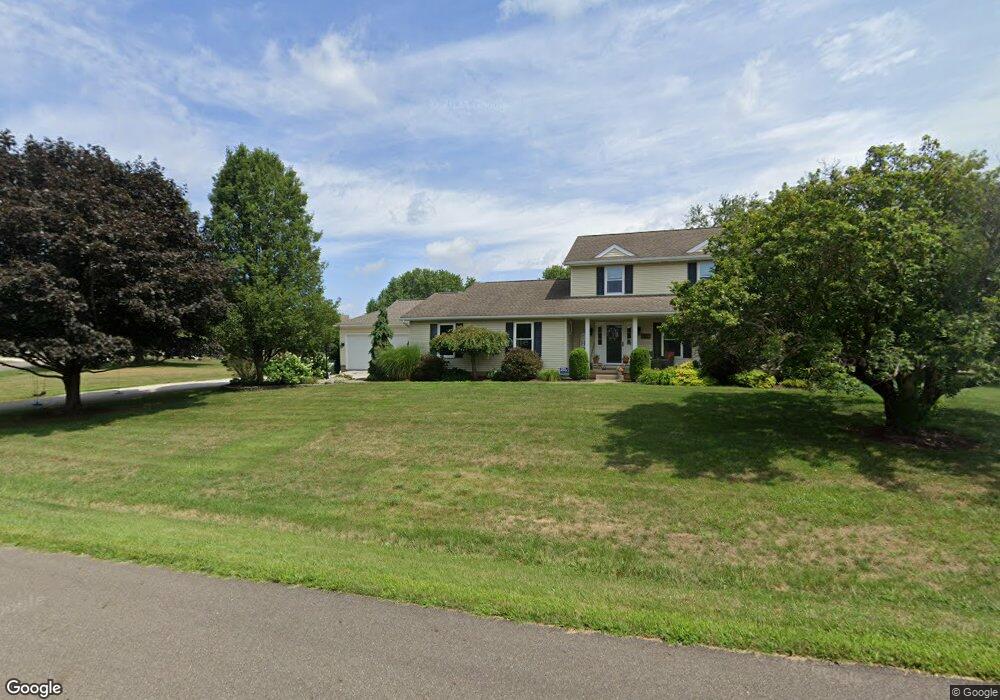
1179 Canyon St NW Uniontown, OH 44685
Estimated Value: $323,000 - $368,000
3
Beds
3
Baths
1,864
Sq Ft
$186/Sq Ft
Est. Value
About This Home
This home is located at 1179 Canyon St NW, Uniontown, OH 44685 and is currently estimated at $346,731, approximately $186 per square foot. 1179 Canyon St NW is a home located in Stark County with nearby schools including Lake Middle/High School and Lake Center Christian School.
Ownership History
Date
Name
Owned For
Owner Type
Purchase Details
Closed on
May 27, 2009
Sold by
Wells Fargo Bank National Association
Bought by
Jakubowski Brian J
Current Estimated Value
Home Financials for this Owner
Home Financials are based on the most recent Mortgage that was taken out on this home.
Original Mortgage
$116,000
Interest Rate
5.49%
Mortgage Type
Purchase Money Mortgage
Purchase Details
Closed on
Aug 20, 2008
Sold by
Raylon Bruce J
Bought by
Wells Fargo Bank Na
Purchase Details
Closed on
Aug 30, 2005
Sold by
Thomas Marvin and Thomas Rhonda Sue
Bought by
Ralyon Bruce J
Home Financials for this Owner
Home Financials are based on the most recent Mortgage that was taken out on this home.
Original Mortgage
$223,250
Interest Rate
7.5%
Mortgage Type
Fannie Mae Freddie Mac
Purchase Details
Closed on
Jul 5, 1991
Create a Home Valuation Report for This Property
The Home Valuation Report is an in-depth analysis detailing your home's value as well as a comparison with similar homes in the area
Home Values in the Area
Average Home Value in this Area
Purchase History
| Date | Buyer | Sale Price | Title Company |
|---|---|---|---|
| Jakubowski Brian J | $145,000 | Attorney | |
| Wells Fargo Bank Na | -- | Allodial Title | |
| Ralyon Bruce J | $211,600 | Quality Title Agency Inc | |
| -- | $12,500 | -- |
Source: Public Records
Mortgage History
| Date | Status | Borrower | Loan Amount |
|---|---|---|---|
| Previous Owner | Jakubowski Brian J | $116,000 | |
| Previous Owner | Ralyon Bruce J | $223,250 |
Source: Public Records
Tax History Compared to Growth
Tax History
| Year | Tax Paid | Tax Assessment Tax Assessment Total Assessment is a certain percentage of the fair market value that is determined by local assessors to be the total taxable value of land and additions on the property. | Land | Improvement |
|---|---|---|---|---|
| 2025 | -- | $119,350 | $27,370 | $91,980 |
| 2024 | -- | $119,350 | $27,370 | $91,980 |
| 2023 | $3,990 | $85,510 | $17,050 | $68,460 |
| 2022 | $2,001 | $85,510 | $17,050 | $68,460 |
| 2021 | $4,048 | $85,510 | $17,050 | $68,460 |
| 2020 | $3,862 | $73,150 | $14,700 | $58,450 |
| 2019 | $3,827 | $73,150 | $14,700 | $58,450 |
| 2018 | $3,828 | $73,150 | $14,700 | $58,450 |
| 2017 | $3,553 | $63,070 | $14,700 | $48,370 |
| 2016 | $3,332 | $59,050 | $14,700 | $44,350 |
| 2015 | $3,330 | $59,050 | $14,700 | $44,350 |
| 2014 | $870 | $52,960 | $13,200 | $39,760 |
| 2013 | $1,435 | $52,960 | $13,200 | $39,760 |
Source: Public Records
Map
Nearby Homes
- 1037 Canyon St NE
- 1771 Midway St NW
- 12055 King Church Ave NW
- 747 Grandview Cir
- 786 Fair Vista Cir SW
- 778 Fair Vista Cir SW
- 11121 Geib Ave NE
- 531 Gentlebrook Blvd SW
- 525 Gentlebrook Blvd SW
- 550 Woodlands Glen Ave
- 12201 King Church Ave NW
- 2084 Hazel St NE
- 510 Meadow Cir SW Unit 11
- 11900 Geib Ave NE
- 425 Tonawanda Trail SW
- 9790 Smithdale Ave NE
- 1975 Eloise Cir NE
- 9766 Smithdale Ave NE
- Unit 9 Meadow Trail SW Unit 9
- 1180 Tessa Trail Unit 1180
- 1137 Canyon St NW
- 0 Jan Cir NW Unit 4444532
- 1178 Canyon St NW
- 11050 Jan Cir NW
- 1188 Canyon St NW
- 1148 Canyon St NW
- 1109 Canyon St NW
- 1130 Canyon St NW
- 11085 Titus Ave NW
- 11068 Jan Cir NW
- 11043 Jan Cir NW
- 10997 Jan Cir NW
- 11025 Titus Ave NW
- 10981 Jan Cir NW
- 10991 Titus Ave NW
- 1169 Royce St NW
- 1189 Royce St NW
- 11105 Titus Ave NW
- 11073 Jan Cir NW
- 1147 Royce St NW