Estimated Value: $281,800 - $336,000
3
Beds
4
Baths
1,491
Sq Ft
$204/Sq Ft
Est. Value
About This Home
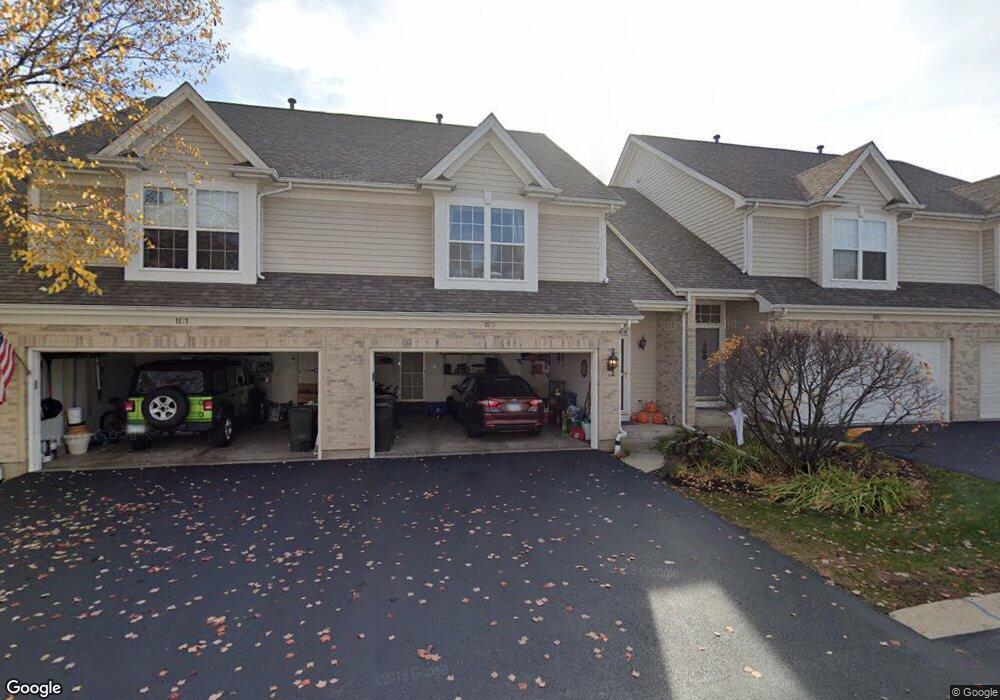
This home is located at 1179 E Danbury Dr Unit 6D, Cary, IL 60013 and is currently estimated at $303,700, approximately $203 per square foot. 1179 E Danbury Dr Unit 6D is a home located in McHenry County with nearby schools including Canterbury Elementary School, Hannah Beardsley Middle School, and Prairie Ridge High School.
Ownership History
Date
Name
Owned For
Owner Type
Purchase Details
Closed on
Aug 16, 2005
Sold by
Sheppleman Gregg R and Pfleger Jeffrey L
Bought by
Tomasello Jill
Current Estimated Value
Home Financials for this Owner
Home Financials are based on the most recent Mortgage that was taken out on this home.
Original Mortgage
$40,500
Interest Rate
5.82%
Mortgage Type
Stand Alone Second
Purchase Details
Closed on
Sep 27, 2002
Sold by
Reckamp Katherine A and Messman Katherine A
Bought by
Sheppelman Gregg R and Pfleger Jeffrey L
Home Financials for this Owner
Home Financials are based on the most recent Mortgage that was taken out on this home.
Original Mortgage
$172,400
Interest Rate
6.32%
Purchase Details
Closed on
Jun 13, 1996
Sold by
Home State Bank National Assn
Bought by
Reckamp Katherine A
Home Financials for this Owner
Home Financials are based on the most recent Mortgage that was taken out on this home.
Original Mortgage
$105,000
Interest Rate
8.13%
Create a Home Valuation Report for This Property
The Home Valuation Report is an in-depth analysis detailing your home's value as well as a comparison with similar homes in the area
Home Values in the Area
Average Home Value in this Area
Purchase History
| Date | Buyer | Sale Price | Title Company |
|---|---|---|---|
| Tomasello Jill | $202,500 | Multiple | |
| Sheppelman Gregg R | $181,500 | Heritage Title Company | |
| Reckamp Katherine A | $148,500 | -- |
Source: Public Records
Mortgage History
| Date | Status | Borrower | Loan Amount |
|---|---|---|---|
| Closed | Tomasello Jill | $40,500 | |
| Open | Tomasello Jill | $162,000 | |
| Previous Owner | Sheppelman Gregg R | $172,400 | |
| Previous Owner | Reckamp Katherine A | $105,000 |
Source: Public Records
Tax History
| Year | Tax Paid | Tax Assessment Tax Assessment Total Assessment is a certain percentage of the fair market value that is determined by local assessors to be the total taxable value of land and additions on the property. | Land | Improvement |
|---|---|---|---|---|
| 2024 | $6,048 | $69,820 | $14,911 | $54,909 |
| 2023 | $5,872 | $62,445 | $13,336 | $49,109 |
| 2022 | $6,005 | $62,754 | $12,036 | $50,718 |
| 2021 | $5,696 | $58,463 | $11,213 | $47,250 |
| 2020 | $5,580 | $56,393 | $10,816 | $45,577 |
| 2019 | $5,437 | $53,975 | $10,352 | $43,623 |
| 2018 | $5,238 | $50,782 | $9,563 | $41,219 |
| 2017 | $5,218 | $47,840 | $9,009 | $38,831 |
| 2016 | $4,454 | $44,870 | $8,450 | $36,420 |
| 2013 | -- | $47,677 | $7,883 | $39,794 |
Source: Public Records
Map
Nearby Homes
- 1259 Chickory Ridge Trail
- 3712 3 Oaks Rd
- 0 Kaper Dr
- 800 Big Bear Trail
- 29 Ivanhoe Ln
- 1150 Amber Dr
- 600 Hillcrest Ln
- 1145 Amber Dr
- 1141 Westlake Dr
- 1293 W Lake Dr
- 413 Haber Rd Unit 5
- 417 Haber Rd Unit 6
- 421 Haber Rd Unit 7
- 425 Haber Rd Unit 6
- +/-5.72 Acres S Illinois Route 31
- 256 Haber Ct
- 86 Silver Tree Cir
- 515 Surrey Ridge Dr
- 4801 Rose St
- 204 Country Commons Rd
- 1171 E Danbury Dr Unit 6C
- 1195 E Danbury Dr Unit 6F
- 1155 E Danbury Dr Unit 6A
- 1187 E Danbury Dr Unit 6E
- 1163 E Danbury Dr
- 1202 Chickory Ridge Trail
- 1145 E Danbury Dr Unit 3F
- 1145 E Danbury Dr Unit 1145
- 1150 E Danbury Dr Unit 5F
- 1174 E Danbury Dr Unit 5C
- 1166 E Danbury Dr Unit 5D
- 1182 E Danbury Dr Unit 5B
- 1190 E Danbury Dr Unit 5A
- 1158 E Danbury Dr Unit 5E
- 1150 E Danbury Dr Unit 1F
- 1172 Chickory Ridge Trail
- 1224 Chickory Ridge Trail
- 1168 Chickory Ridge Trail
- 1233 W Danbury Dr Unit 7E
- 1225 W Danbury Dr Unit 7D
Your Personal Tour Guide
Ask me questions while you tour the home.