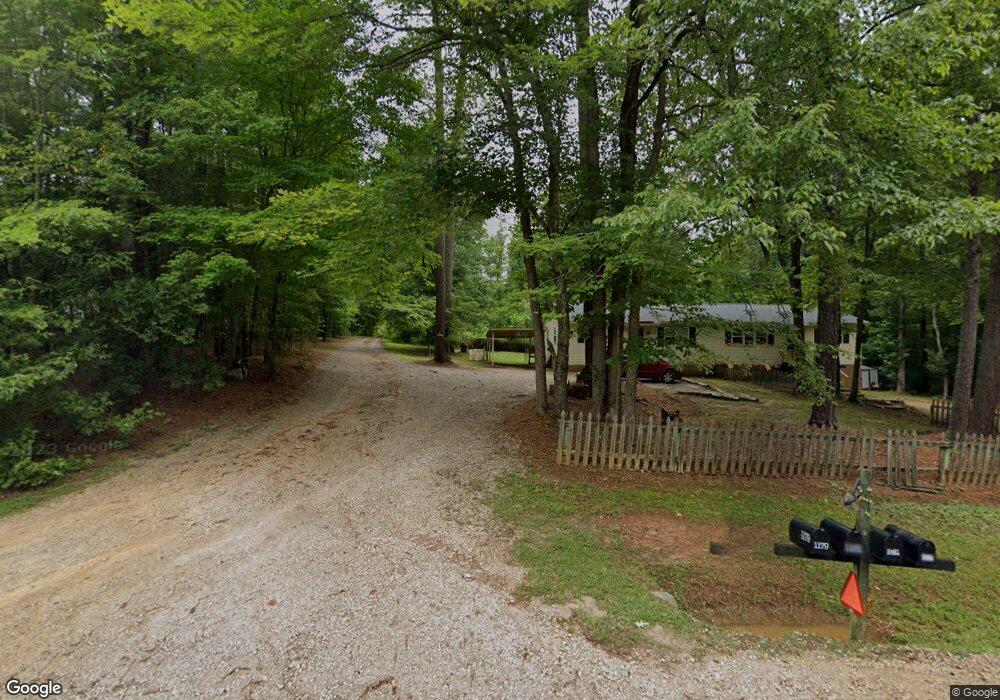
1179 N Main St Wake Forest, NC 27587
Estimated Value: $388,000 - $751,000
Studio
3
Baths
2,016
Sq Ft
$255/Sq Ft
Est. Value
About This Home
This home is located at 1179 N Main St, Wake Forest, NC 27587 and is currently estimated at $513,552, approximately $254 per square foot. 1179 N Main St is a home located in Wake County with nearby schools including Richland Creek Elementary School, Wake Forest-Rolesville Middle School, and Wake Forest High School.
Ownership History
Date
Name
Owned For
Owner Type
Purchase Details
Closed on
Jun 21, 2021
Sold by
Hardman Devin W and Hardman Brandi
Bought by
Hardman Devin W and Hardman Brandi
Current Estimated Value
Home Financials for this Owner
Home Financials are based on the most recent Mortgage that was taken out on this home.
Original Mortgage
$168,000
Outstanding Balance
$152,103
Interest Rate
2.9%
Mortgage Type
New Conventional
Estimated Equity
$361,449
Purchase Details
Closed on
Jan 11, 2010
Sold by
Amos Fred D
Bought by
Amos Ii Fred B and Hallamos Leslie
Purchase Details
Closed on
Aug 28, 2007
Sold by
Shelton Andrea R
Bought by
Amos Ii Fred B
Purchase Details
Closed on
Dec 20, 2001
Sold by
Deese Betty A
Bought by
Colony Homes Llc and Colony Homes Of North Carolina Llc
Purchase Details
Closed on
Nov 15, 2001
Sold by
Amos Fred B and Shelton Andrea R
Bought by
Amos Ii Fred B and Shelton Andrea R
Create a Home Valuation Report for This Property
The Home Valuation Report is an in-depth analysis detailing your home's value as well as a comparison with similar homes in the area
Home Values in the Area
Average Home Value in this Area
Purchase History
We collect this data history from publicly available records. To have your information removed, we recommend requesting removal directly through your county’s website.
| Date | Buyer | Sale Price | Title Company |
|---|---|---|---|
| Hardman Devin W | -- | None Available | |
| Amos Ii Fred B | -- | None Available | |
| Amos Ii Fred B | -- | None Available | |
| Colony Homes Llc | $350,000 | -- | |
| Amos Ii Fred B | -- | -- |
Source: Public Records
Mortgage History
We collect this data history from publicly available records. To have your information removed, we recommend requesting removal directly through your county’s website.
| Date | Status | Borrower | Loan Amount |
|---|---|---|---|
| Open | Hardman Devin W | $168,000 |
Source: Public Records
Tax History
| Year | Tax Paid | Tax Assessment Tax Assessment Total Assessment is a certain percentage of the fair market value that is determined by local assessors to be the total taxable value of land and additions on the property. | Land | Improvement |
|---|---|---|---|---|
| 2025 | $2,428 | $373,418 | $132,000 | $241,418 |
| 2024 | $2,359 | $373,418 | $132,000 | $241,418 |
| 2023 | $1,983 | $249,187 | $90,000 | $159,187 |
| 2022 | $1,840 | $249,187 | $90,000 | $159,187 |
| 2021 | $1,791 | $249,187 | $90,000 | $159,187 |
| 2020 | $1,762 | $249,187 | $90,000 | $159,187 |
| 2019 | $1,679 | $200,701 | $80,000 | $120,701 |
| 2018 | $1,546 | $200,701 | $80,000 | $120,701 |
| 2017 | $1,467 | $200,701 | $80,000 | $120,701 |
| 2016 | $1,438 | $200,701 | $80,000 | $120,701 |
| 2015 | $1,566 | $219,705 | $95,000 | $124,705 |
| 2014 | $1,486 | $219,705 | $95,000 | $124,705 |
Source: Public Records
Map
Nearby Homes
- 428 Golden Dragonfly St
- 424 Golden Dragonfly St
- 945 Alma Railway Dr Unit 559
- 933 Alma Railway Dr Unit 553
- 1133 Bellreng Dr
- 935 Alma Railway Dr Unit 554
- 104 Jordan Ln
- 955 Alma Railway Dr Unit 563
- 1205 Barnford Mill Rd
- 0 Ralph Dr
- 401 French Broad St
- 724 Dragonfly Pond Way
- 717 Dragonfly Pond Way
- 201 Amaryllis Way
- 1304 Barnford Mill Rd
- 321 Conrad Ln
- 317 Conrad Ln
- 720 Dragonfly Pond Way
- 708 Dragonfly Pond Way
- 733 Dragonfly Pond Way
- 1179 N Main St Unit 1179
- 1173 N Main St
- 1175 N Main St
- 1171 N Main St
- 1185 N Main St
- 1161 N Main St
- 1193 N Main St
- 1163 N Main St
- The Birch II E Plan at
- The Ashport L Plan at
- The Beech C Plan at
- The Hickory II D Plan at
- The Aspen C Plan at
- The Willow G Plan at
- The Beech B Plan at
- The Aspen B Plan at
- The Hickory II E Plan at
- 1159 N Main St
- 1149 N Main St
- 1168 N Main St
Your Personal Tour Guide
Ask me questions while you tour the home.