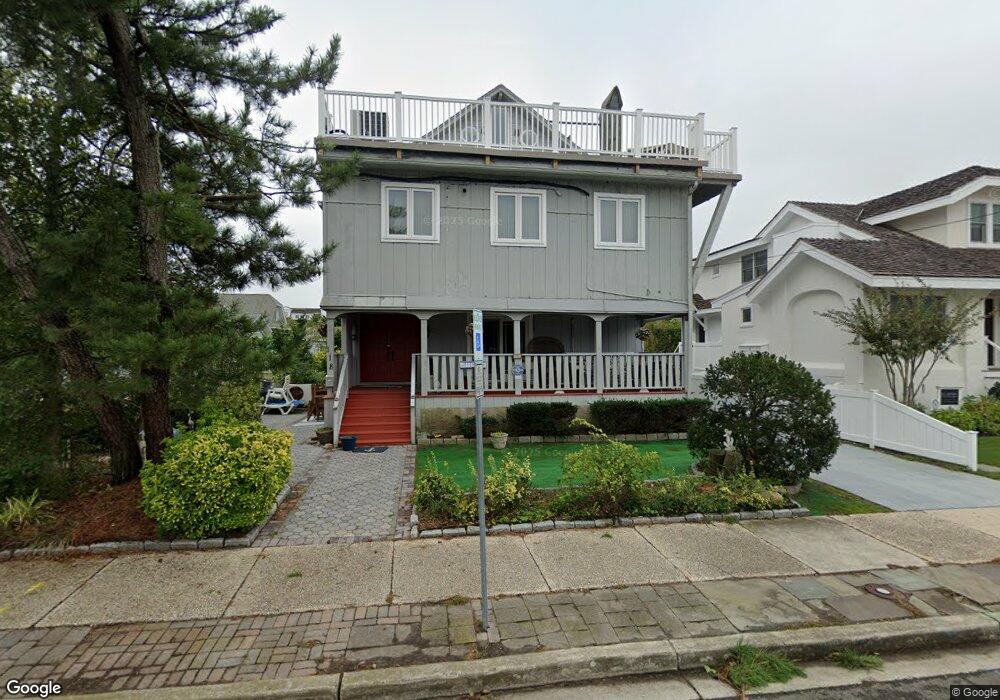
118 21st St Avalon, NJ 08202
Estimated Value: $3,608,182 - $6,397,000
Studio
--
Bath
4,350
Sq Ft
$1,053/Sq Ft
Est. Value
About This Home
This home is located at 118 21st St, Avalon, NJ 08202 and is currently estimated at $4,579,796, approximately $1,052 per square foot. 118 21st St is a home located in Cape May County with nearby schools including Avalon Elementary School.
Ownership History
Date
Name
Owned For
Owner Type
Purchase Details
Closed on
Feb 12, 2022
Sold by
Cellucci John R
Bought by
Cellucci Kathleen C
Current Estimated Value
Purchase Details
Closed on
Mar 16, 2012
Sold by
Cellucci John R and Cellucci Edna Hobson
Bought by
Cellucci John R and Cellucci Edna Hobson
Purchase Details
Closed on
Jun 6, 2003
Sold by
Cellucci John
Bought by
Celucci John R and Cellucci Edna H
Create a Home Valuation Report for This Property
The Home Valuation Report is an in-depth analysis detailing your home's value as well as a comparison with similar homes in the area
Home Values in the Area
Average Home Value in this Area
Purchase History
| Date | Buyer | Sale Price | Title Company |
|---|---|---|---|
| Cellucci Kathleen C | -- | None Listed On Document | |
| Cellucci John R | -- | None Available | |
| Celucci John R | -- | -- |
Source: Public Records
Tax History
| Year | Tax Paid | Tax Assessment Tax Assessment Total Assessment is a certain percentage of the fair market value that is determined by local assessors to be the total taxable value of land and additions on the property. | Land | Improvement |
|---|---|---|---|---|
| 2025 | $8,471 | $1,379,700 | $1,010,500 | $369,200 |
| 2024 | $8,471 | $1,379,700 | $1,010,500 | $369,200 |
| 2023 | $8,402 | $1,379,700 | $1,010,500 | $369,200 |
| 2022 | $7,837 | $1,379,700 | $1,010,500 | $369,200 |
| 2021 | $7,523 | $1,379,700 | $1,010,500 | $369,200 |
| 2020 | $7,257 | $1,379,700 | $1,010,500 | $369,200 |
| 2019 | $7,036 | $1,379,700 | $1,010,500 | $369,200 |
| 2018 | $6,733 | $1,379,700 | $1,010,500 | $369,200 |
| 2017 | $6,314 | $1,135,600 | $777,400 | $358,200 |
| 2016 | $6,246 | $1,135,600 | $777,400 | $358,200 |
| 2015 | $6,144 | $1,135,600 | $777,400 | $358,200 |
| 2014 | $6,075 | $1,135,600 | $777,400 | $358,200 |
Source: Public Records
Map
Nearby Homes
- 118 22nd St
- 2023 Dune Dr Unit R6
- 174 23rd St
- 76 21st St W
- 211 23rd St
- 178 19th St
- 1838 First Ave
- 212 25th St Unit End Unit
- 179 27th St
- 2425 Harbor Ave Unit 2425
- 53 25th St E
- 389 22nd St
- 890 21st St
- 386 24th St
- 386 24th St Unit Upper
- 1668 Ocean Dr Unit B1
- 16 4th Ave
- 74 26th St E
- 8 27th St Unit West
- 415 20th St
Your Personal Tour Guide
Ask me questions while you tour the home.