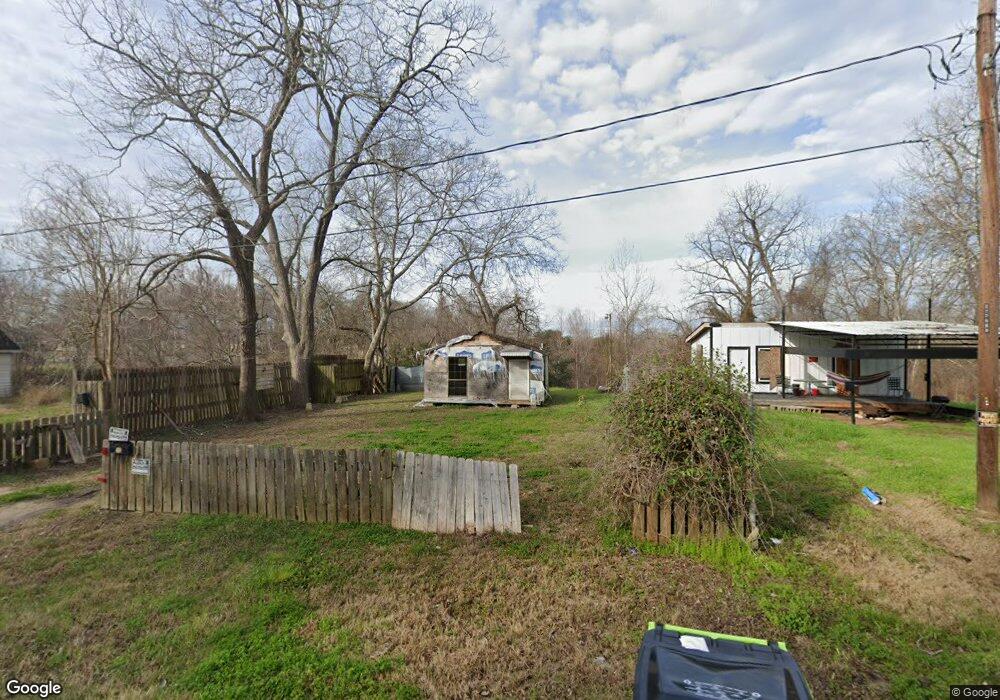
118 6th St Rosenberg, TX 77471
Estimated Value: $88,000 - $259,000
1
Bed
1
Bath
390
Sq Ft
$388/Sq Ft
Est. Value
About This Home
This home is located at 118 6th St, Rosenberg, TX 77471 and is currently estimated at $151,138, approximately $387 per square foot. 118 6th St is a home located in Fort Bend County with nearby schools including Jackson Elementary School, George Junior High School, and B.F. Terry High School.
Ownership History
Date
Name
Owned For
Owner Type
Purchase Details
Closed on
Jan 30, 2015
Sold by
Cardenas Ramon
Bought by
Cardenas Valentine
Current Estimated Value
Purchase Details
Closed on
Nov 6, 2012
Sold by
Dorr Costable A J
Bought by
Yield Invesmtnts Llc
Purchase Details
Closed on
Dec 31, 2003
Sold by
Cardenas Gonzalo
Bought by
Cardenas Ramon
Purchase Details
Closed on
Apr 22, 1998
Sold by
Kalafut John George
Bought by
Kalafut Desiree Reeves
Create a Home Valuation Report for This Property
The Home Valuation Report is an in-depth analysis detailing your home's value as well as a comparison with similar homes in the area
Home Values in the Area
Average Home Value in this Area
Purchase History
| Date | Buyer | Sale Price | Title Company |
|---|---|---|---|
| Cardenas Valentine | -- | None Available | |
| Yield Invesmtnts Llc | -- | None Available | |
| Cardenas Ramon | -- | -- | |
| Yield Investments Llc | -- | -- | |
| Kalafut Desiree Reeves | -- | -- |
Source: Public Records
Tax History
| Year | Tax Paid | Tax Assessment Tax Assessment Total Assessment is a certain percentage of the fair market value that is determined by local assessors to be the total taxable value of land and additions on the property. | Land | Improvement |
|---|---|---|---|---|
| 2025 | $1,627 | $77,038 | $22,500 | $54,538 |
| 2024 | $1,627 | $86,126 | $22,500 | $63,626 |
| 2023 | $1,376 | $71,273 | $19,000 | $52,273 |
| 2022 | $624 | $30,470 | $19,000 | $11,470 |
| 2021 | $475 | $22,910 | $19,000 | $3,910 |
| 2020 | $506 | $23,850 | $19,000 | $4,850 |
| 2019 | $613 | $26,850 | $19,000 | $7,850 |
| 2018 | $351 | $15,140 | $7,500 | $7,640 |
| 2017 | $560 | $24,000 | $7,500 | $16,500 |
| 2016 | $478 | $20,470 | $7,500 | $12,970 |
| 2015 | $480 | $20,470 | $7,500 | $12,970 |
| 2014 | $189 | $7,940 | $7,500 | $440 |
Source: Public Records
Map
Nearby Homes
Your Personal Tour Guide
Ask me questions while you tour the home.