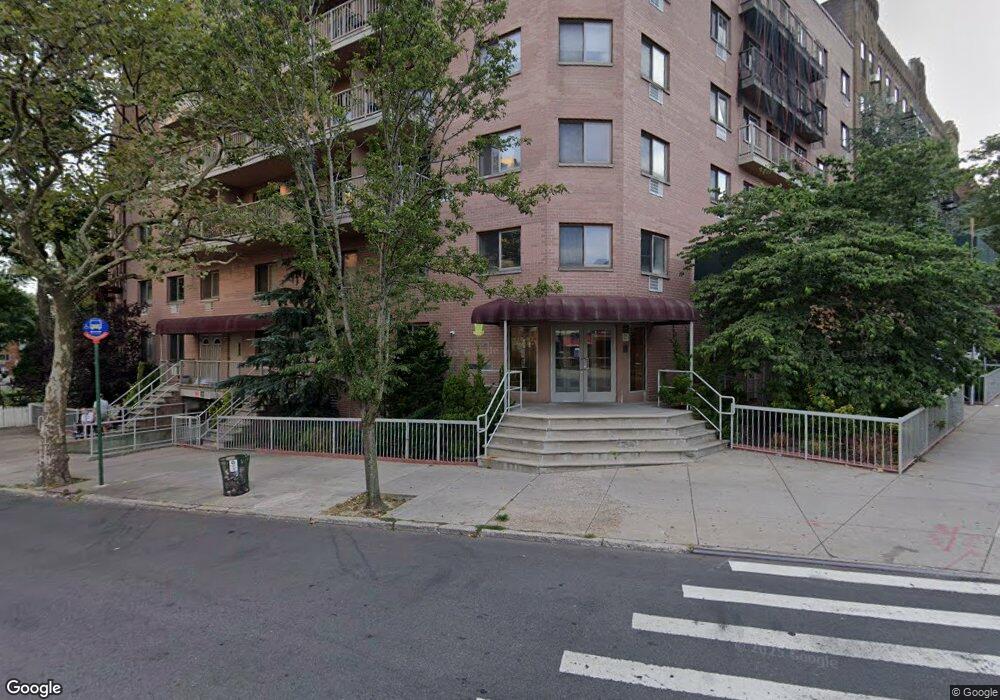
118-82 Metropolitan Ave Unit 4C Kew Gardens, NY 11415
Kew Gardens NeighborhoodEstimated Value: $235,000 - $344,000
--
Bed
1
Bath
376
Sq Ft
$775/Sq Ft
Est. Value
About This Home
This home is located at 118-82 Metropolitan Ave Unit 4C, Kew Gardens, NY 11415 and is currently estimated at $291,531, approximately $775 per square foot. 118-82 Metropolitan Ave Unit 4C is a home located in Queens County with nearby schools including P.S. 51, P.S. 56 - Harry Eichler, and M.S.137 America's School of Heroes.
Ownership History
Date
Name
Owned For
Owner Type
Purchase Details
Closed on
Nov 3, 2023
Sold by
Wong Frederick Brian and Wong Karn Mayme
Bought by
Lu Eliza and Lu Timothy
Current Estimated Value
Purchase Details
Closed on
Jul 30, 2010
Sold by
Nowak Dariusz
Bought by
Mayme Wong Karn and Wong Frederick
Home Financials for this Owner
Home Financials are based on the most recent Mortgage that was taken out on this home.
Original Mortgage
$161,600
Interest Rate
4.57%
Mortgage Type
Purchase Money Mortgage
Purchase Details
Closed on
Oct 10, 2003
Sold by
Paternostro Frank N and Paternostro Jeanine C
Bought by
Dariusz Nowak
Home Financials for this Owner
Home Financials are based on the most recent Mortgage that was taken out on this home.
Original Mortgage
$123,000
Interest Rate
5.86%
Mortgage Type
Purchase Money Mortgage
Purchase Details
Closed on
May 6, 2002
Sold by
Metropolitan Ave Assoc
Bought by
Paternostro Frank N and Paternostro Jeanine
Create a Home Valuation Report for This Property
The Home Valuation Report is an in-depth analysis detailing your home's value as well as a comparison with similar homes in the area
Home Values in the Area
Average Home Value in this Area
Purchase History
| Date | Buyer | Sale Price | Title Company |
|---|---|---|---|
| Lu Eliza | $275,000 | -- | |
| Mayme Wong Karn | $202,000 | -- | |
| Dariusz Nowak | $137,500 | -- | |
| Paternostro Frank N | -- | -- |
Source: Public Records
Mortgage History
| Date | Status | Borrower | Loan Amount |
|---|---|---|---|
| Previous Owner | Mayme Wong Karn | $161,600 | |
| Previous Owner | Dariusz Nowak | $123,000 |
Source: Public Records
Tax History Compared to Growth
Tax History
| Year | Tax Paid | Tax Assessment Tax Assessment Total Assessment is a certain percentage of the fair market value that is determined by local assessors to be the total taxable value of land and additions on the property. | Land | Improvement |
|---|---|---|---|---|
| 2025 | $3,905 | $32,323 | $3,073 | $29,250 |
| 2024 | $3,221 | $31,232 | $3,073 | $28,159 |
| 2023 | $2,878 | $30,761 | $3,073 | $27,688 |
| 2022 | $3,397 | $30,887 | $3,073 | $27,814 |
| 2021 | $3,295 | $29,442 | $3,073 | $26,369 |
| 2020 | $3,251 | $33,540 | $3,073 | $30,467 |
| 2019 | $3,061 | $30,691 | $3,073 | $27,618 |
| 2018 | $2,964 | $25,634 | $3,073 | $22,561 |
| 2017 | $2,661 | $24,279 | $3,073 | $21,206 |
| 2016 | $2,274 | $24,279 | $3,073 | $21,206 |
| 2015 | $754 | $22,021 | $3,073 | $18,948 |
| 2014 | $754 | $19,697 | $3,073 | $16,624 |
Source: Public Records
Map
Nearby Homes
- 118-82 Metropolitan Ave Unit 1B
- 118-66 Metropolitan Ave Unit 5F
- 118-66 Metropolitan Ave Unit 6J
- 83-44 Lefferts Blvd Unit 3C
- 83-44 Lefferts Blvd Unit 6M
- 83-44 Lefferts Blvd Unit 6C
- 83-44 Lefferts Blvd Unit 4 R
- 118-60 Metropolitan Ave Unit 1J
- 119-40 Metropolitan Ave Unit 2
- 83-55 Lefferts Blvd Unit 1E
- 83-55 Lefferts Blvd Unit 6F
- 83-28 Abingdon Rd
- 83-83 118th St Unit 6L
- 83-83 118th St Unit 2D
- 83-83 118th St Unit 4A
- 83-75 118th St Unit 4H
- 84-25 120th St
- 83-36 Beverly Rd Unit 6D
- 83-36 Beverly Rd Unit 5A
- 84-15 120th St
- 118-82 Metropolitan Ave Unit 7D
- 118-82 Metropolitan Ave Unit 5H
- 118-82 Metropolitan Ave Unit 5A
- 118-82 Metropolitan Ave Unit 5G
- 118-82 Metropolitan Ave Unit 5-E
- 118-82 Metropolitan Ave Unit 6D
- 118-82 Metropolitan Ave Unit 6A
- 118-82 Metropolitan Ave Unit 3G
- 118-82 Metropolitan Ave Unit 2G
- 118-82 Metropolitan Ave Unit 5F
- 118-82 Metropolitan Ave Unit 1 F
- 118-82 Metropolitan Ave Unit 3C
- 118-82 Metropolitan Ave Unit 1 G
- 118-82 Metropolitan Ave Unit 4A
- 118-82 Metropolitan Ave Unit 7C
- 118-82 Metropolitan Ave
- 118-82 Metropolitan Ave Unit 5C
- 118-82 Metropolitan Ave Unit 3F
- 118-82 Metropolitan Ave Unit 3A