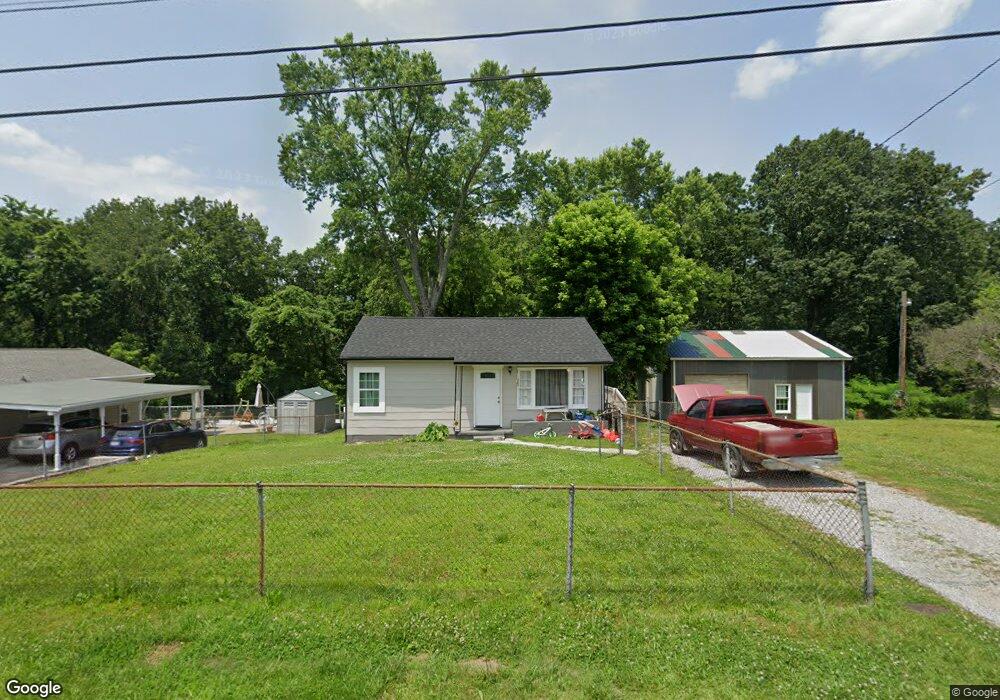
118 Anderson Rd Rossville, GA 30741
Estimated Value: $104,441 - $153,000
--
Bed
--
Bath
816
Sq Ft
$163/Sq Ft
Est. Value
About This Home
This home is located at 118 Anderson Rd, Rossville, GA 30741 and is currently estimated at $133,110, approximately $163 per square foot. 118 Anderson Rd is a home with nearby schools including Rossville Elementary School, Rossville Middle School, and Ridgeland High School.
Ownership History
Date
Name
Owned For
Owner Type
Purchase Details
Closed on
May 19, 2021
Sold by
Nida Terry
Bought by
Rogers Carthell and Rogers Pamela
Current Estimated Value
Purchase Details
Closed on
May 5, 2019
Sold by
Nida Terry S
Bought by
Mclacklan Herbert A and Mclacklan Lybriscaldean B
Purchase Details
Closed on
Oct 14, 1995
Sold by
Alexander Billy Joe
Bought by
Nida Terry and Carthell Rogers
Purchase Details
Closed on
May 9, 1994
Sold by
Alexander Billy Joe
Bought by
Alexander Billy Joe
Purchase Details
Closed on
Aug 4, 1993
Sold by
Johnson James G and Johnson
Bought by
Alexander Billy Joe
Purchase Details
Closed on
Apr 17, 1991
Sold by
Clark Mary Elizabeth and Clark
Bought by
Johnson James G and Johnson
Purchase Details
Closed on
Dec 1, 1979
Sold by
Leonard J T
Bought by
Clark Mary Elizabeth and Clark
Purchase Details
Closed on
Jan 1, 1972
Bought by
Leonard J T
Create a Home Valuation Report for This Property
The Home Valuation Report is an in-depth analysis detailing your home's value as well as a comparison with similar homes in the area
Home Values in the Area
Average Home Value in this Area
Purchase History
| Date | Buyer | Sale Price | Title Company |
|---|---|---|---|
| Rogers Carthell | -- | -- | |
| Mclacklan Herbert A | -- | -- | |
| Nida Terry S | -- | -- | |
| Nida Terry | $25,500 | -- | |
| Alexander Billy Joe | $600 | -- | |
| Alexander Billy Joe | $21,500 | -- | |
| Johnson James G | $20,000 | -- | |
| Clark Mary Elizabeth | -- | -- | |
| Leonard J T | -- | -- |
Source: Public Records
Tax History Compared to Growth
Tax History
| Year | Tax Paid | Tax Assessment Tax Assessment Total Assessment is a certain percentage of the fair market value that is determined by local assessors to be the total taxable value of land and additions on the property. | Land | Improvement |
|---|---|---|---|---|
| 2024 | $957 | $40,963 | $2,400 | $38,563 |
| 2023 | $930 | $38,842 | $2,400 | $36,442 |
| 2022 | $715 | $26,895 | $2,400 | $24,495 |
| 2021 | $534 | $17,274 | $2,400 | $14,874 |
| 2020 | $478 | $14,520 | $2,400 | $12,120 |
| 2019 | $485 | $14,520 | $2,400 | $12,120 |
| 2018 | $406 | $15,328 | $2,400 | $12,928 |
| 2017 | $550 | $15,328 | $2,400 | $12,928 |
| 2016 | $505 | $15,328 | $2,400 | $12,928 |
| 2015 | $499 | $14,152 | $1,716 | $12,436 |
| 2014 | $422 | $14,152 | $1,716 | $12,436 |
| 2013 | -- | $14,152 | $1,716 | $12,436 |
Source: Public Records
Map
Nearby Homes
- 820 Park City Rd
- 0 Park City Rd Unit 1519998
- 610 Corbley Rd
- 811 Park City Rd
- 328 S Mission Ridge Dr
- Lot 82 Battle Bluff Dr
- Lot 78 Battle Bluff Dr
- 47 Battle Bluff Dr
- 42 Battle Bluff Dr
- 515 Hogan Rd
- 823 Schmitt Rd
- 705 Park City Rd
- 74 Kriswood Dr
- 164 S Mission Ridge Dr
- 238 Longview Dr
- 0 Miami Ave Unit 1505680
- Lot 81 Battle Bluff Dr
- Lot 80 Battle Bluff Dr
- Lot 79 Battle Bluff Dr
- 116 Anderson Rd
- 120 Anderson Rd
- 122 Anderson Rd
- 117 Anderson Rd
- 111 Anderson Rd
- 114 Battle Bluff Dr
- 112 Anderson Rd
- 107 Anderson Rd
- 108 Anderson Rd
- 105 Anderson Rd
- 124 Cleveland Rd
- 106 Anderson Rd
- 126 Cleveland Rd
- 120 Cleveland Rd
- 1003 Park City Rd
- 116 Cleveland Rd
- 103 Anderson Rd Unit B
- 103 Anderson Rd
- 103 Anderson Rd
- 114 Cleveland Rd