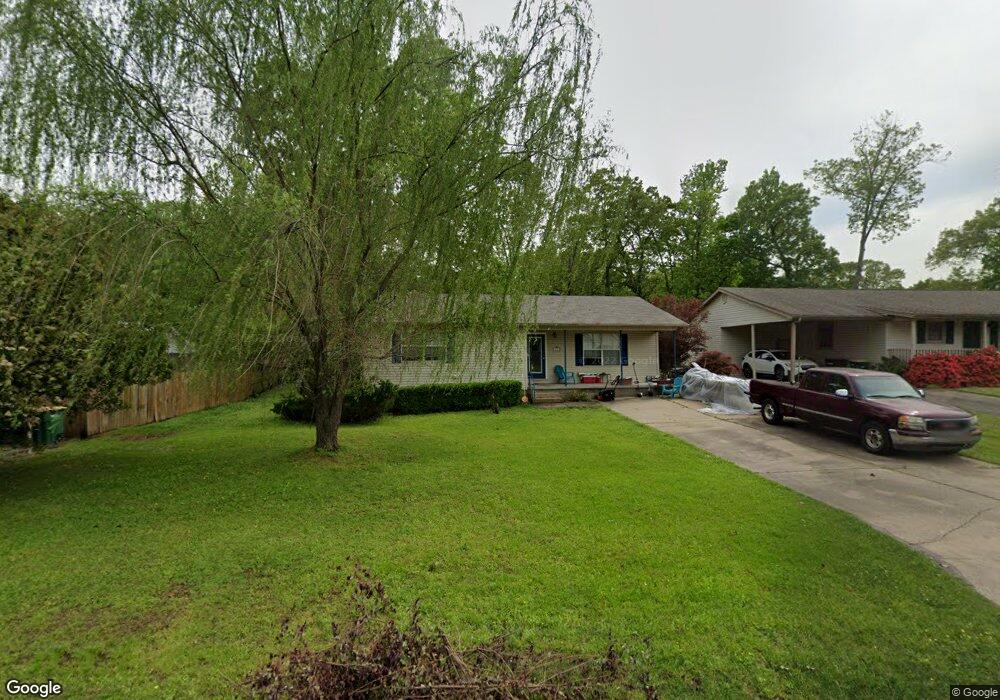
118 Bob o Link Ln Sherwood, AR 72120
Estimated Value: $157,580 - $180,000
3
Beds
2
Baths
1,188
Sq Ft
$138/Sq Ft
Est. Value
About This Home
This home is located at 118 Bob o Link Ln, Sherwood, AR 72120 and is currently estimated at $164,395, approximately $138 per square foot. 118 Bob o Link Ln is a home located in Pulaski County with nearby schools including Sherwood Elementary School, Sylvan Hills Middle School, and Sylvan Hills High School.
Ownership History
Date
Name
Owned For
Owner Type
Purchase Details
Closed on
Jul 7, 2017
Sold by
Lee Pascal J and Kinder Pascal J
Bought by
Coulter Sarah
Current Estimated Value
Home Financials for this Owner
Home Financials are based on the most recent Mortgage that was taken out on this home.
Original Mortgage
$101,134
Outstanding Balance
$82,582
Interest Rate
3.37%
Mortgage Type
FHA
Estimated Equity
$81,813
Purchase Details
Closed on
Jun 21, 1999
Sold by
Real Estate Central Commercial Inc
Bought by
Kinder Aaron W and Kinder Pascal J
Home Financials for this Owner
Home Financials are based on the most recent Mortgage that was taken out on this home.
Original Mortgage
$60,941
Interest Rate
7.21%
Mortgage Type
FHA
Purchase Details
Closed on
Jan 29, 1999
Sold by
Bradley J C
Bought by
Real Estate Central Inc
Create a Home Valuation Report for This Property
The Home Valuation Report is an in-depth analysis detailing your home's value as well as a comparison with similar homes in the area
Home Values in the Area
Average Home Value in this Area
Purchase History
| Date | Buyer | Sale Price | Title Company |
|---|---|---|---|
| Coulter Sarah | $103,000 | American Abstract & Title Co | |
| Kinder Aaron W | $61,000 | River City Title Company | |
| Real Estate Central Inc | $3,000 | Beach Abstract & Guaranty Co |
Source: Public Records
Mortgage History
| Date | Status | Borrower | Loan Amount |
|---|---|---|---|
| Open | Coulter Sarah | $101,134 | |
| Previous Owner | Kinder Aaron W | $60,941 |
Source: Public Records
Tax History Compared to Growth
Tax History
| Year | Tax Paid | Tax Assessment Tax Assessment Total Assessment is a certain percentage of the fair market value that is determined by local assessors to be the total taxable value of land and additions on the property. | Land | Improvement |
|---|---|---|---|---|
| 2025 | $1,226 | $26,207 | $3,200 | $23,007 |
| 2024 | $1,124 | $26,207 | $3,200 | $23,007 |
| 2023 | $1,124 | $26,207 | $3,200 | $23,007 |
| 2022 | $1,224 | $26,207 | $3,200 | $23,007 |
| 2021 | $1,127 | $19,610 | $3,300 | $16,310 |
| 2020 | $747 | $19,610 | $3,300 | $16,310 |
| 2019 | $747 | $19,610 | $3,300 | $16,310 |
| 2018 | $1,122 | $19,610 | $3,300 | $16,310 |
| 2017 | $698 | $19,610 | $3,300 | $16,310 |
| 2016 | $914 | $17,550 | $2,700 | $14,850 |
| 2015 | $891 | $17,549 | $2,700 | $14,849 |
| 2014 | $891 | $16,349 | $2,700 | $13,649 |
Source: Public Records
Map
Nearby Homes
- 121 Bob o Link Ln
- 2206 E Lee Ave
- 2204 E Lee Ave
- 5809 Woodview Dr N
- 0 Catterton Dr
- 5908 Glenhaven Place
- 1926 E Lee Ave
- 110 Ann Ave
- 2001 E Kiehl Ave
- 208 Ann Ave
- +/- 21.56 Acres Stafford Rd
- 1501 Stafford Rd
- Lot 2 Witts Dr
- Lot 1 Witts Dr
- 1423 Stafford Rd
- 8218 Park Ave
- 1419 Stafford Rd
- 6 Thornhill Dr
- 1415 Stafford Rd
- 12 Ridgewell Rd
- 116 Bob o Link Ln
- 120 Bob o Link Ln
- 119 Bob o Link Ln
- 122 Bob o Link Ln
- 117 Bob o Link Ln
- 117 Bob o Link Ln
- 123 Bob o Link Ln
- 115 Bob o Link Ln
- 115 Redbud Ave
- 112 Bob o Link Ln
- 106 Dogwood Ln
- 125 Bob o Link Ln
- 113 Redbud Ave
- 0 Redbud Ave
- 113 Bob o Link Ln
- 120 Cottonwood Ave
- 116 Cottonwood Ave
- 124 Cottonwood Ave
- 0 Cottonwood Ave
- 127 Bob o Link Ln