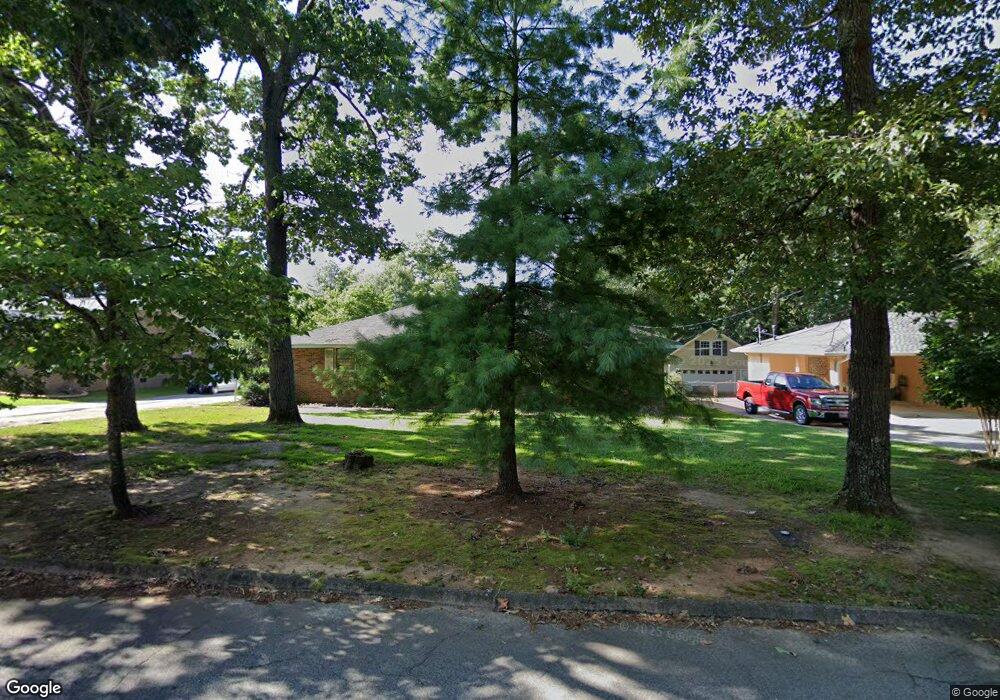
118 Bobolink Dr Griffin, GA 30224
Spalding County NeighborhoodEstimated Value: $202,000 - $242,000
3
Beds
2
Baths
1,508
Sq Ft
$148/Sq Ft
Est. Value
About This Home
This home is located at 118 Bobolink Dr, Griffin, GA 30224 and is currently estimated at $223,643, approximately $148 per square foot. 118 Bobolink Dr is a home located in Spalding County with nearby schools including Crescent Road Elementary School, Rehoboth Road Middle School, and Spalding High School.
Ownership History
Date
Name
Owned For
Owner Type
Purchase Details
Closed on
Jan 28, 2005
Sold by
Flynn Wayne D and Flynn Carol
Bought by
Ridgeway Johnny
Current Estimated Value
Home Financials for this Owner
Home Financials are based on the most recent Mortgage that was taken out on this home.
Original Mortgage
$118,000
Outstanding Balance
$59,622
Interest Rate
5.66%
Mortgage Type
New Conventional
Estimated Equity
$164,021
Purchase Details
Closed on
Nov 10, 1971
Sold by
Andrews A R
Bought by
Flynn Wayne D and Flynn Carol
Purchase Details
Closed on
Apr 16, 1971
Sold by
Murray George
Bought by
Andrews A R
Purchase Details
Closed on
Aug 7, 1970
Sold by
Fgs Enterprises
Bought by
Murray George and Williams Simons
Purchase Details
Closed on
Apr 4, 1970
Sold by
Addison George J and Freeman Ralph W
Bought by
Fgs Enterprises
Purchase Details
Closed on
Mar 21, 1968
Bought by
Addison George J and Freeman Ralph W
Create a Home Valuation Report for This Property
The Home Valuation Report is an in-depth analysis detailing your home's value as well as a comparison with similar homes in the area
Home Values in the Area
Average Home Value in this Area
Purchase History
| Date | Buyer | Sale Price | Title Company |
|---|---|---|---|
| Ridgeway Johnny | $118,000 | -- | |
| Flynn Wayne D | $26,900 | -- | |
| Andrews A R | $10,800 | -- | |
| Murray George | $62,800 | -- | |
| Fgs Enterprises | $51,700 | -- | |
| Addison George J | -- | -- |
Source: Public Records
Mortgage History
| Date | Status | Borrower | Loan Amount |
|---|---|---|---|
| Open | Ridgeway Johnny | $118,000 |
Source: Public Records
Tax History Compared to Growth
Tax History
| Year | Tax Paid | Tax Assessment Tax Assessment Total Assessment is a certain percentage of the fair market value that is determined by local assessors to be the total taxable value of land and additions on the property. | Land | Improvement |
|---|---|---|---|---|
| 2024 | $1,989 | $55,608 | $9,200 | $46,408 |
| 2023 | $1,989 | $51,879 | $9,200 | $42,679 |
| 2022 | $1,801 | $49,518 | $8,000 | $41,518 |
| 2021 | $1,457 | $40,079 | $8,000 | $32,079 |
| 2020 | $1,315 | $36,028 | $8,000 | $28,028 |
| 2019 | $1,341 | $36,028 | $8,000 | $28,028 |
| 2018 | $1,277 | $33,420 | $8,000 | $25,420 |
| 2017 | $1,242 | $33,420 | $8,000 | $25,420 |
| 2016 | $1,265 | $33,420 | $8,000 | $25,420 |
| 2015 | $1,302 | $33,420 | $8,000 | $25,420 |
| 2014 | $1,328 | $33,420 | $8,000 | $25,420 |
Source: Public Records
Map
Nearby Homes
- 105 Jewel Dr
- 114 Maddox Rd
- 115 Kline Cir
- 1801, 1831 & 19 Zebulon Rd
- 227 Brown Acres Rd
- 36 Laurelwood Cir
- 7 Crabapple Cir
- 133 Coldwater Ln
- 139 Coldwater Ln
- 1 Sweetbriar Ln Unit A
- 1479 Gloria St
- 145 Coldwater Way
- 1473 Gloria St
- 0 Cedardale Dr Unit 10272855
- 1064 Cold Water Dr
- 1491 Wesley Dr
- 0 Martin Luther King jr Pkwy Unit 19-41 BYPASS HIGHWAY
- TRACT D Cedardale Drive Sweetbriar Ln
- 1480 Wesley Dr
- 0 Sweetbriar Ln Unit B 20110670
- 120 Bobolink Dr
- 116 Bobolink Dr
- 123 Woodmont Dr
- 125 Woodmont Dr
- 122 Bobolink Dr
- 114 Bobolink Dr
- 119 Bobolink Dr
- 121 Bobolink Dr
- 117 Bobolink Dr
- 119 Woodmont Dr
- 127 Woodmont Dr
- 123 Bobolink Dr
- 124 Bobolink Dr
- 112 Bobolink Dr
- 113 Bobolink Dr
- 117 Woodmont Dr
- 125 Bobolink Dr
- 122 Woodmont Dr
- 124 Woodmont Dr
- 120 Brice St